
Extra Chance Creators and How to Find Them
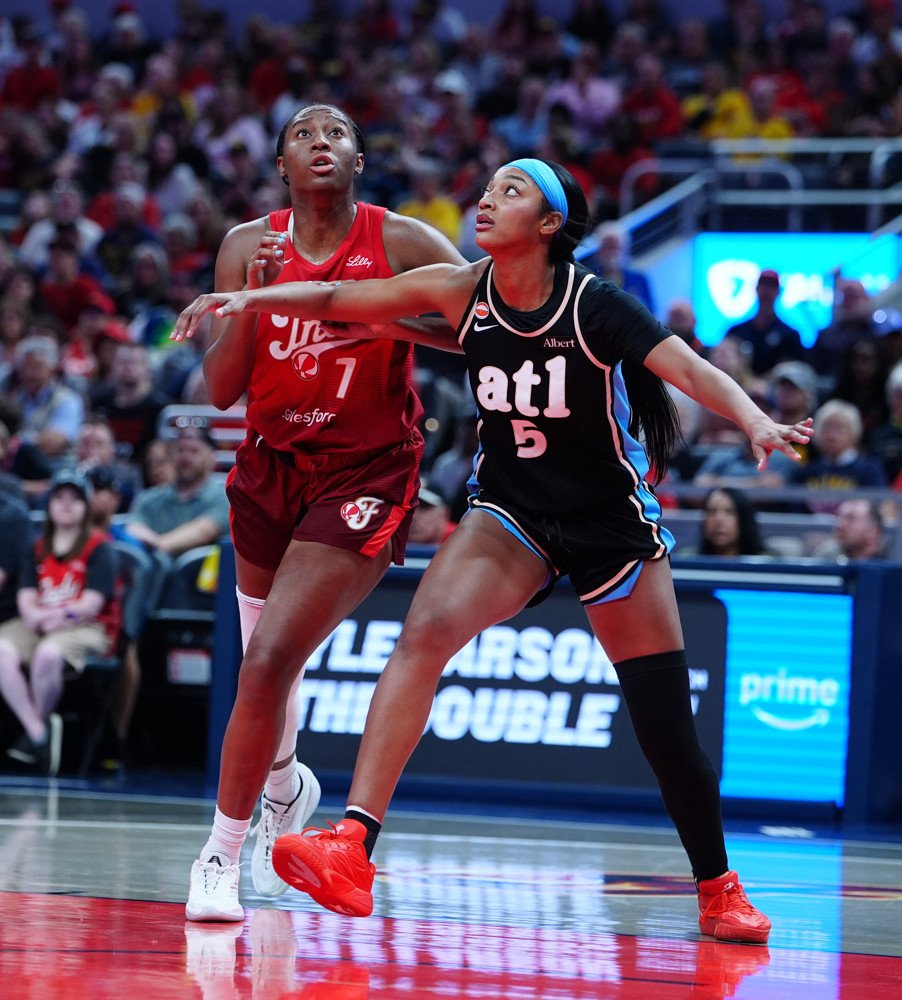
Angel Reese’s box office boxouts have lifted the Atlanta Dream into an extra chance powerhouse. | Photo by Brian Spurlock/Icon Sportswire
We are in an efficiency era. Fans and pundits are quick to point to efficiency metrics, particularly when it comes to scoring and creation. Sure, she scored 30, but what was her true shooting percentage? Ten assists sounds good on paper, but what was the assist to turnover ratio?
These are valid questions as we try to separate who is making things happen from who is doing it at a difference-making level. However, alternatives are worth considering: what can teams do to give themselves an edge besides scoring efficiently? After all, shot creation and shot making are generally star qualities and last time we checked, those don’t grow on trees.
Great defense is certainly an answer, but from an offensive standpoint, there is only one other pathway—more volume, that is, more scoring opportunities. If we were to flatten basketball into a board game, its core loop would be reminiscent of a turn-based strategy game: one side takes a turn, i.e. hunts for the best shot, and make or miss, the other side then takes theirs. Yet this back-and-forth sequence can be interrupted.
Teams can “cut in line”, snatching offensive rebounds or forcing turnovers, earning themselves extra turns to score before opponents can counter. Moving forward, we’ll categorize all additional scoring opportunities created through offensive rebounds and turnovers as “extra chances” or “XC.”
Of course, this is a two-way street. In every game, both sides vie for offensive rebounds and try to force turnovers, so it’s only meaningful to see which teams are outdoing their opponents and by what margin. Looking across the league and standardizing team stats to 100 possessions to normalize for pace, there’s a clear number one.
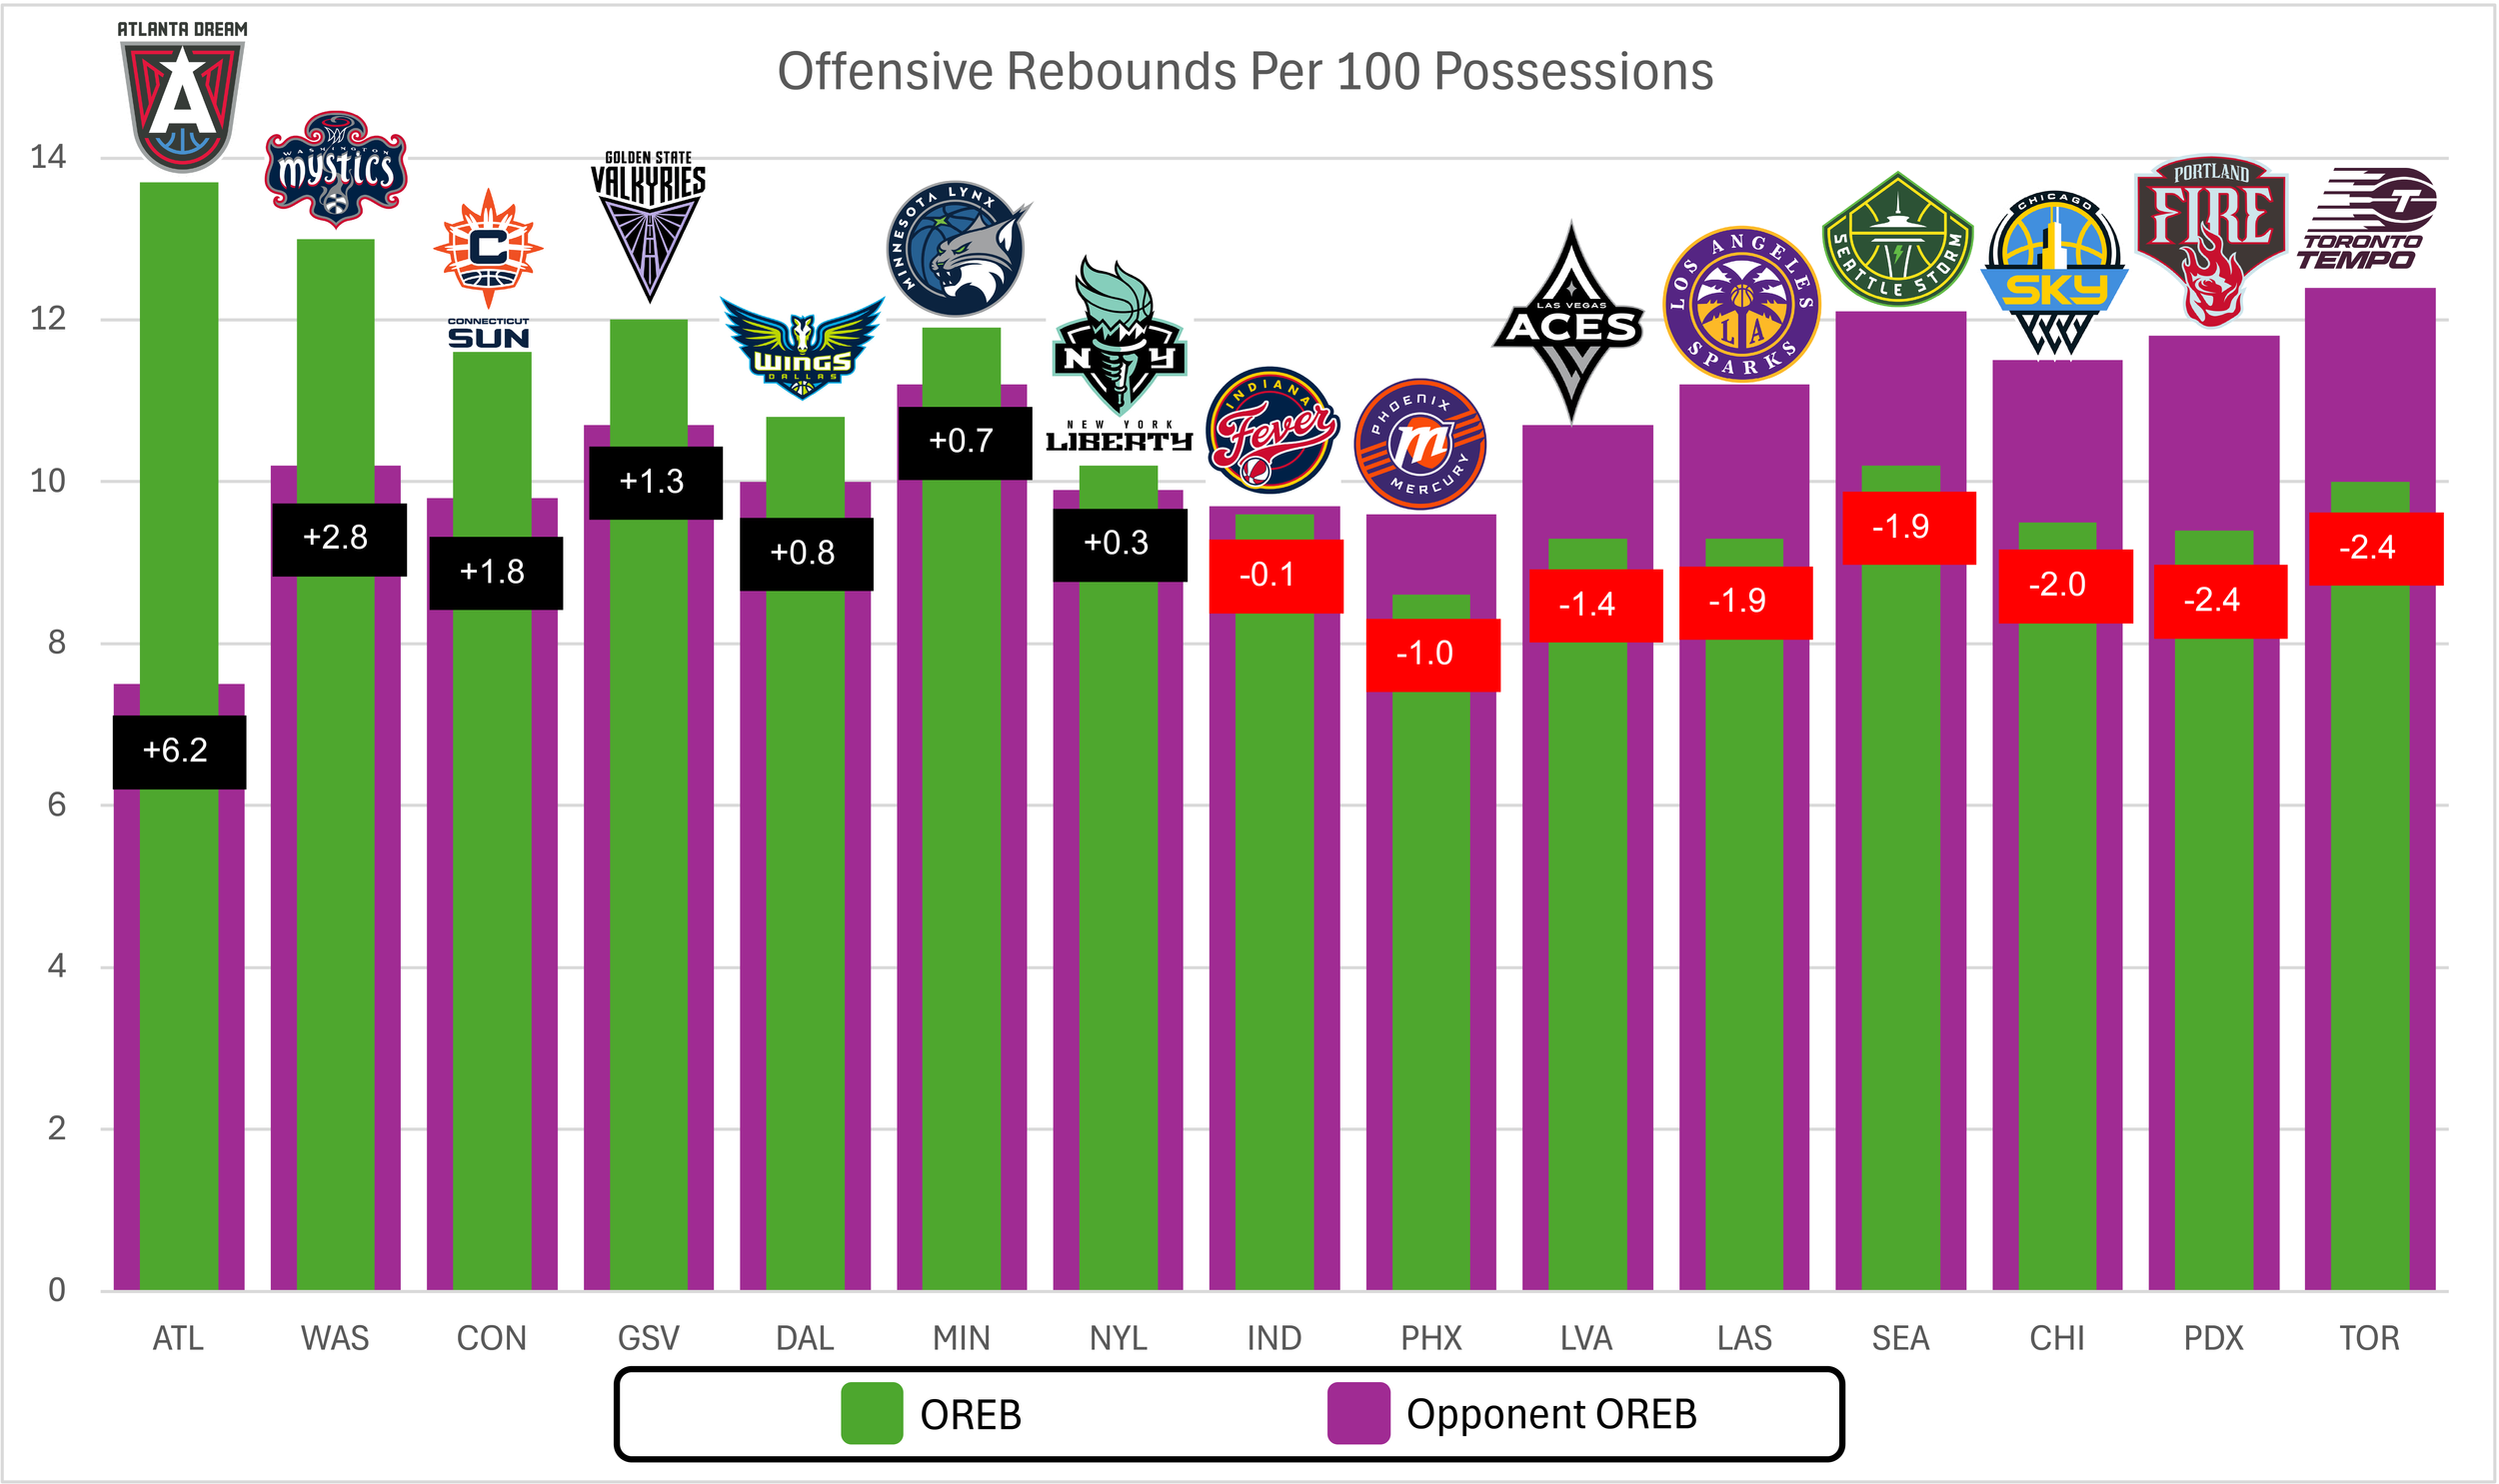
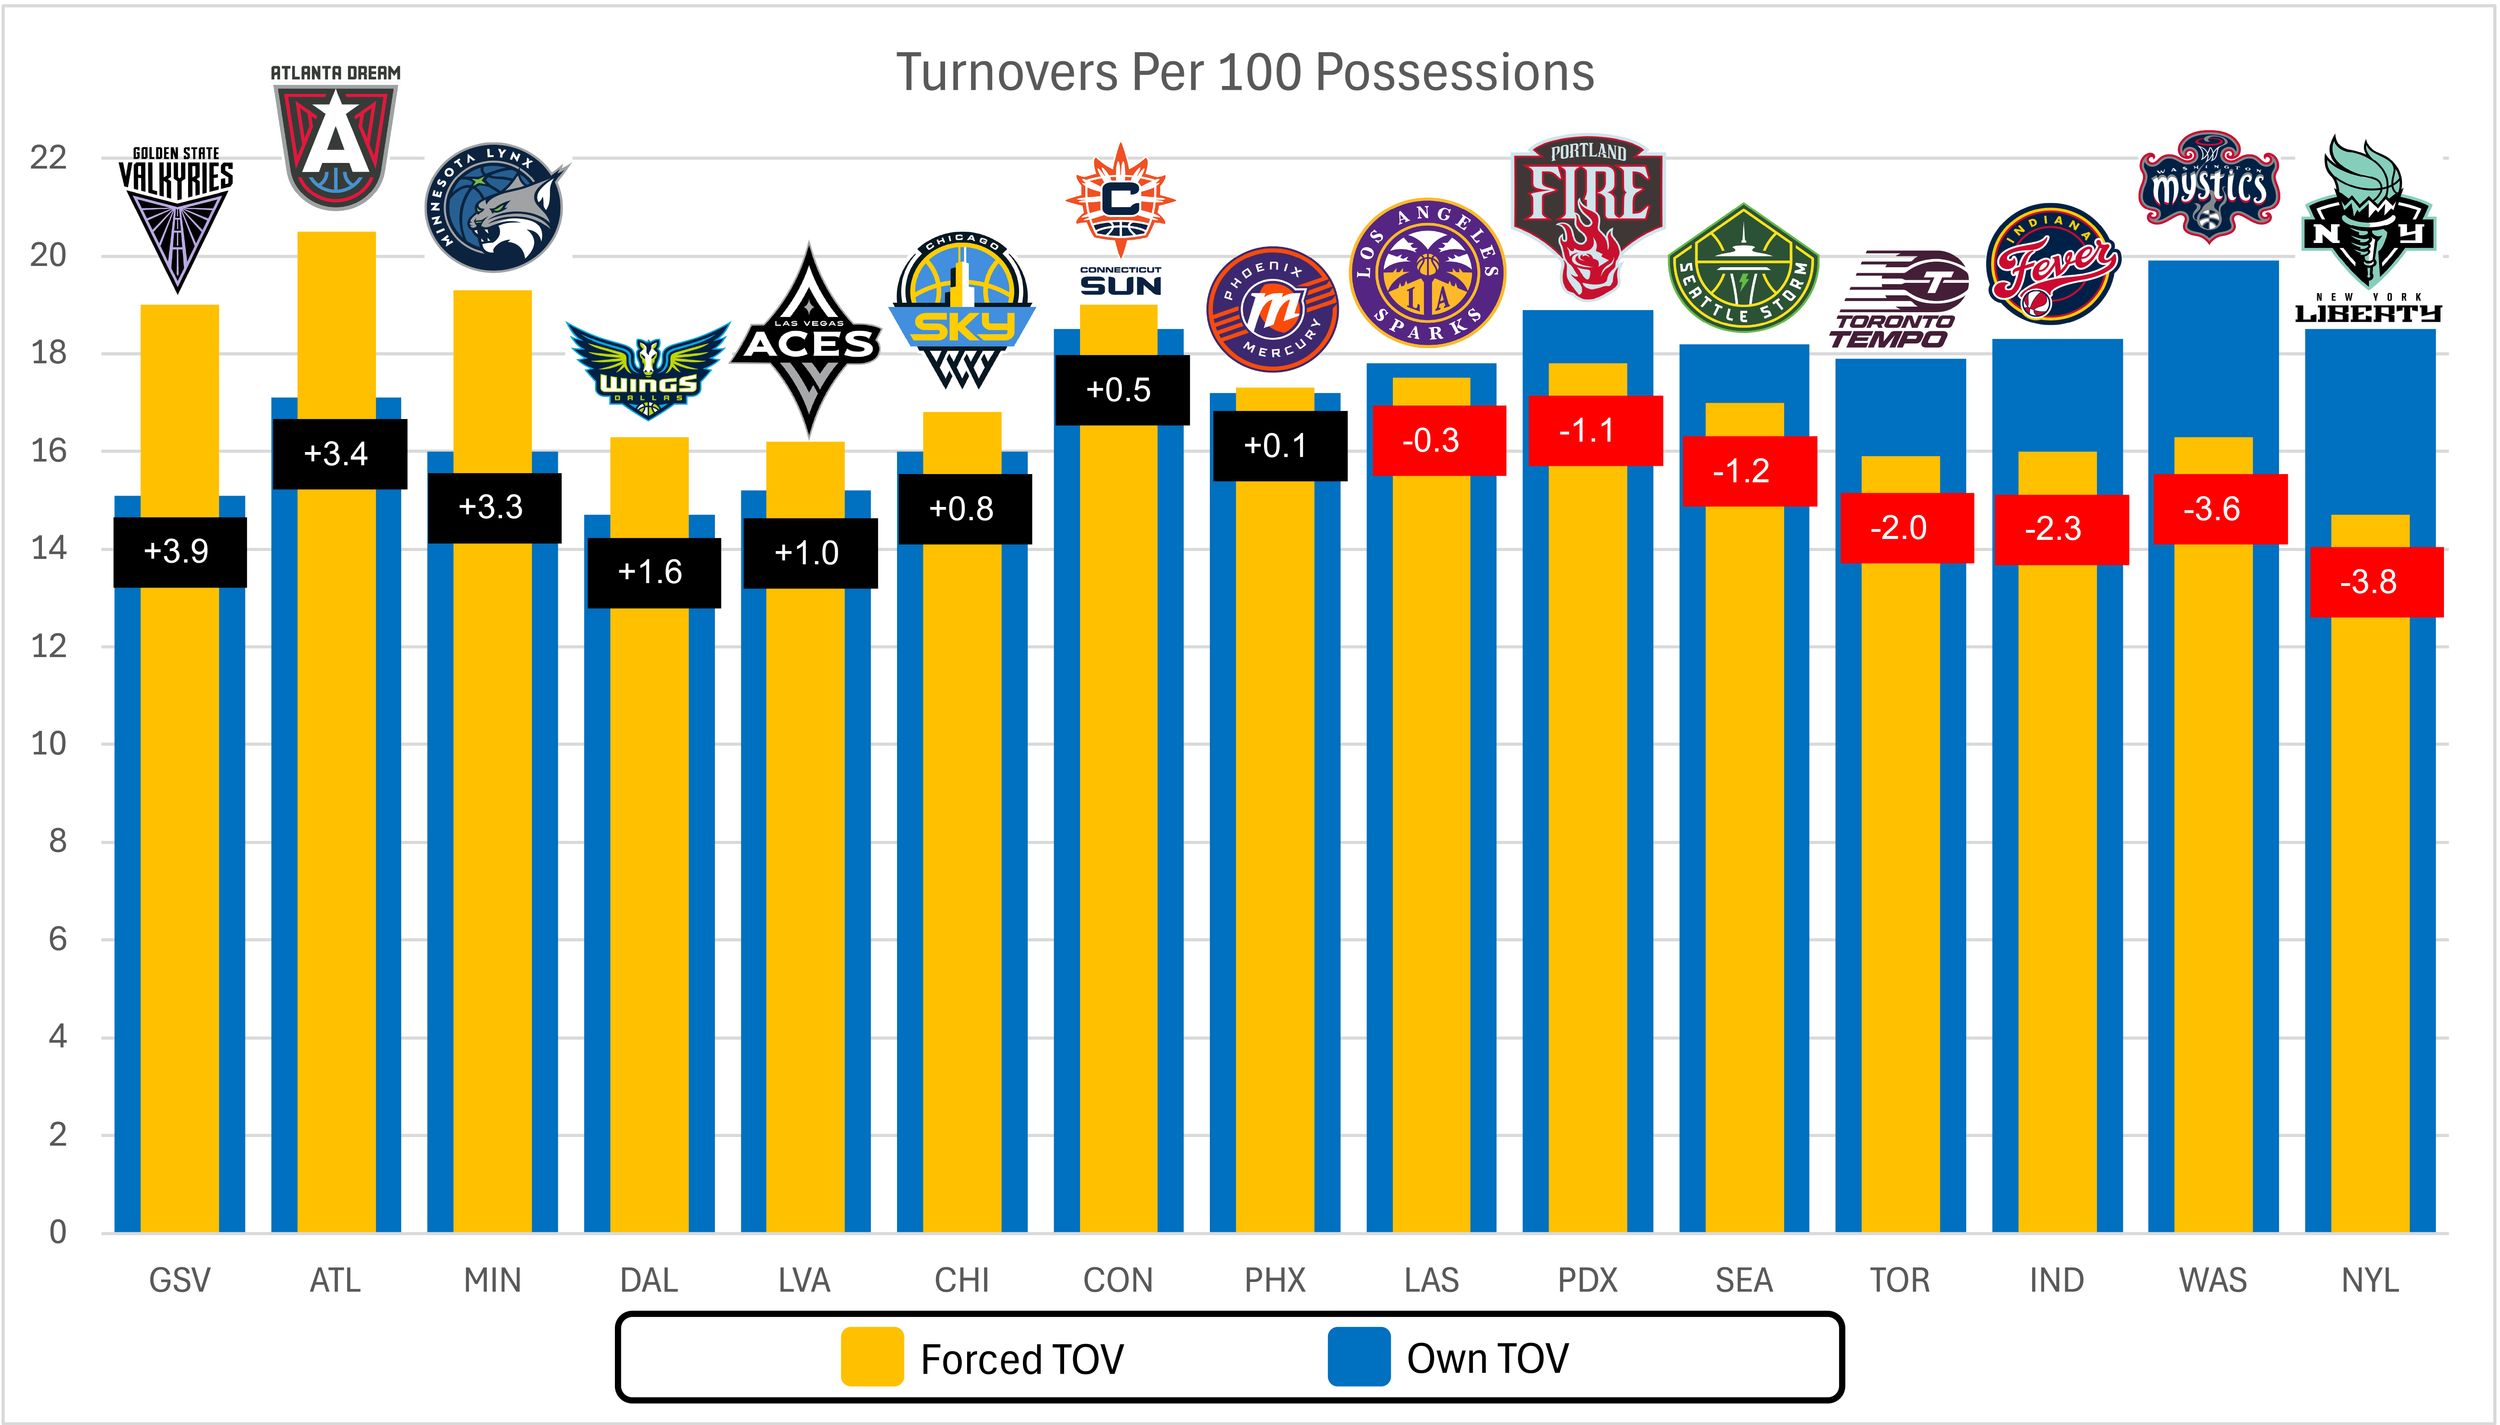
The Atlanta Dream are the best in the league at securing relative extra chances, and it’s not particularly close. They are in a tier of their own, crashing the offensive glass better than anyone but also routinely limiting opponents to a league-low offensive rebound rate. They do a phenomenal job winning the turnover margin too—trailing only the Valkyries in net turnovers forced. Their domination in these categories grants them a total average of 9.6 extra chances relative to their opponent per 100 possessions. Meanwhile, the Valkyries and the Lynx form a strong second tier, earning 5.2 and 4 extra chances per 100, respectively.
And how much are these extra chances worth? A common adage is that a team is the biggest threat to score after an offensive rebound because the rebounder is likely close to the rim and shooters are likely open. Another is that a team is toughest to stop after a steal because of the impending fastbreak.
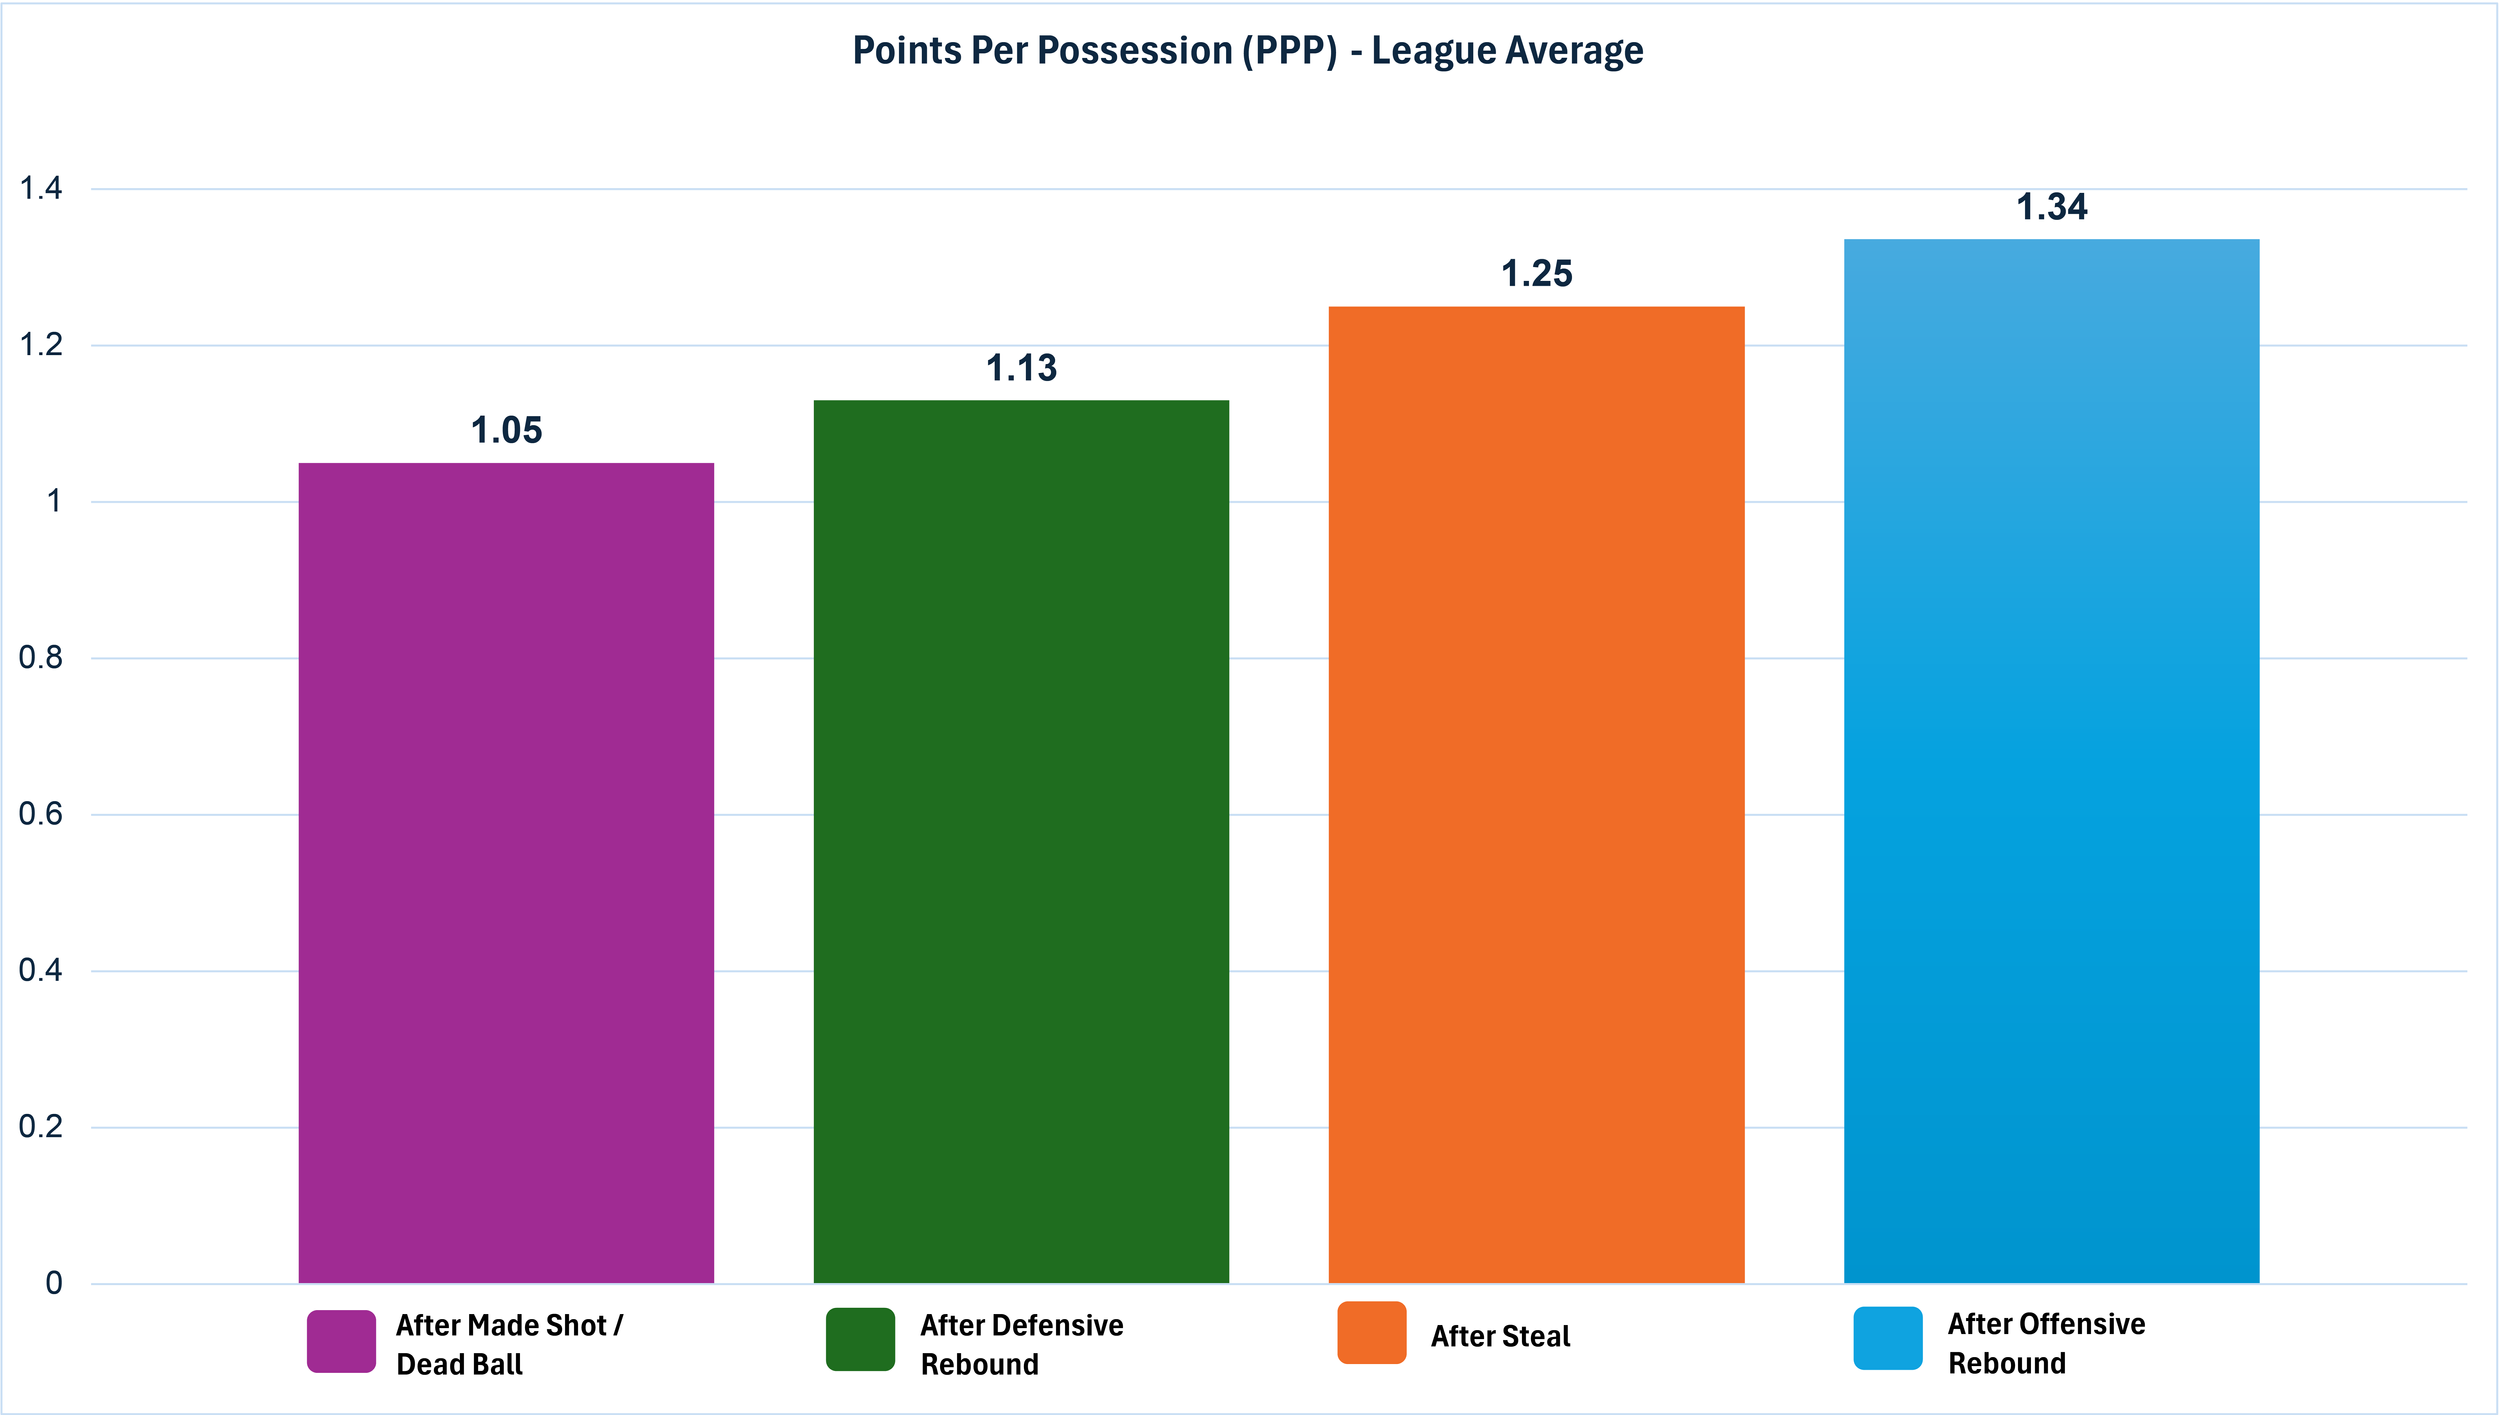
Steals make up 53% of turnovers this season. The other 47% are dead ball turnovers.
Based on the league averages on points per possession, it appears the most valuable possessions are ones with offensive rebounds, and the second-most are ones that occur after steals. So however scarce these possessions may be, they are worth their weight in gold.
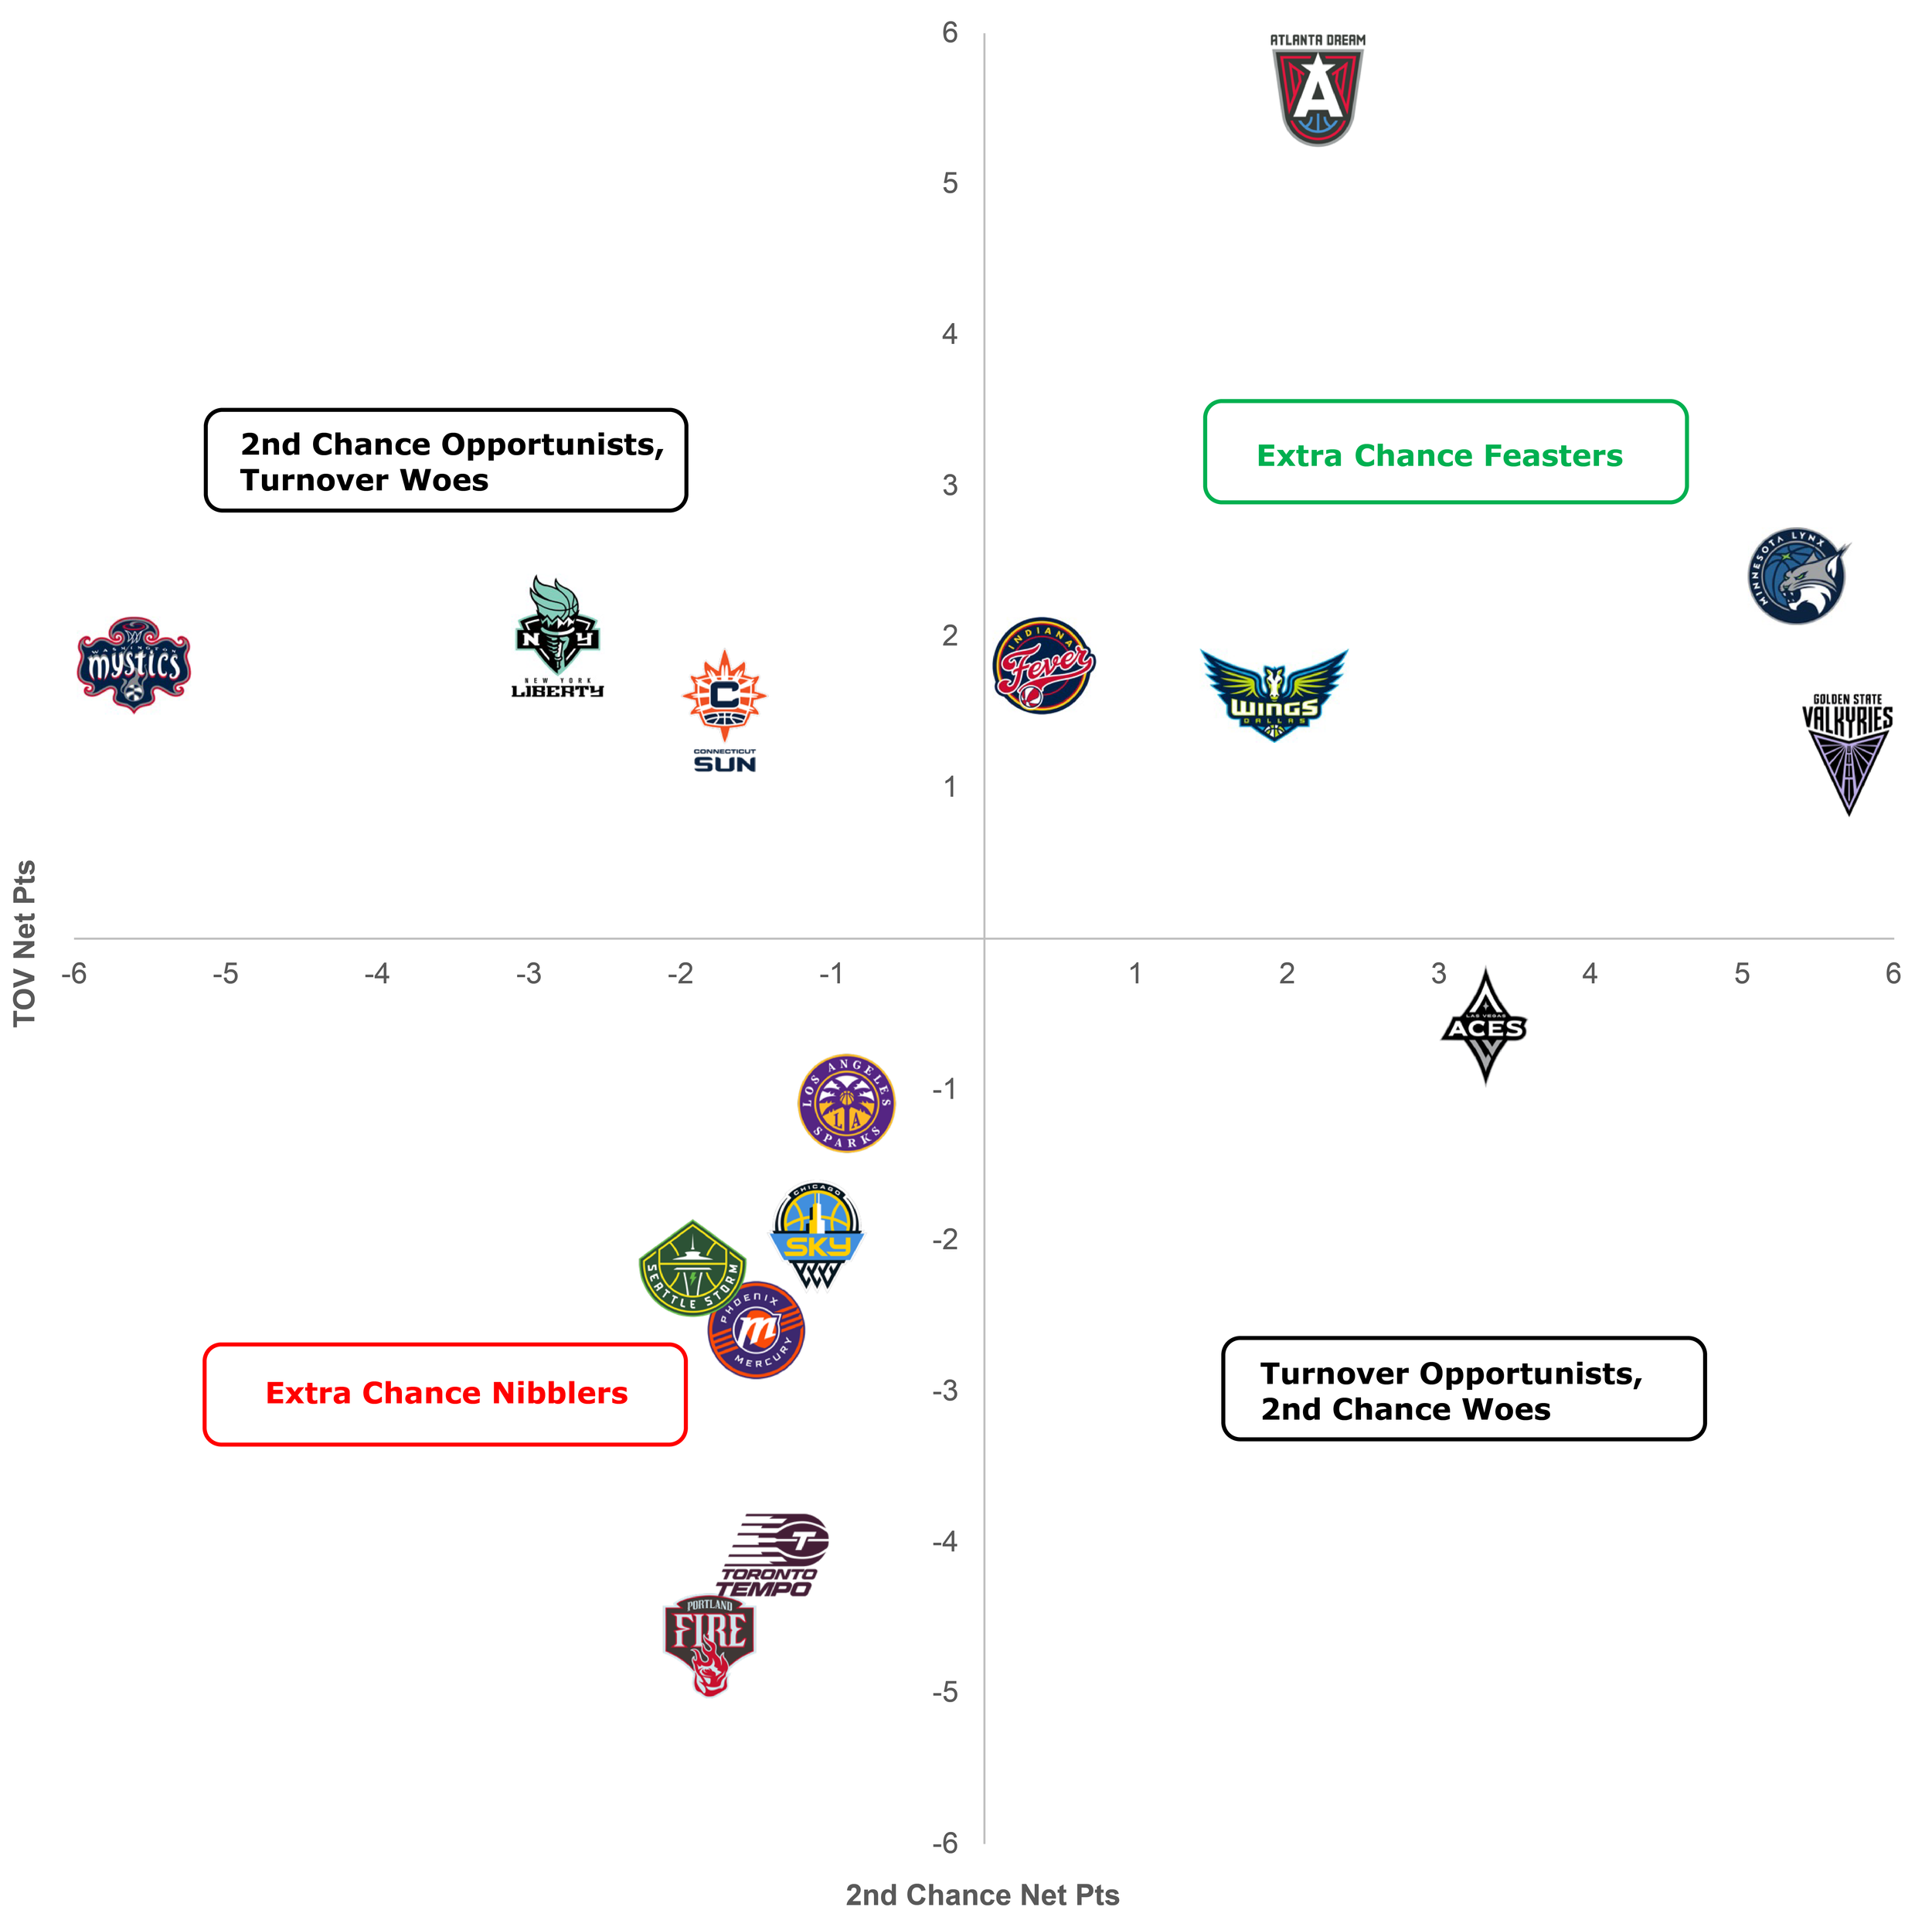
Still, earning extra chances and cashing them in are two different things. A comparison of each team’s net points from offensive rebounds and turnovers relative to their opponents give us a clear picture on which teams have routinely been making extra chances a competitive advantage.
Net Extra Chance Points Per 100 Possessions
Surprise: the Dream share the pole position with the Lynx when it comes to total net extra chance points at 7.8 per 100 possessions. This is mostly due to the Lynx’s efficiency in converting their extra chance opportunities (third in PPP after Oreb, sixth after steals), and the Dream’s ick when they have to taste their own medicine, conceding an eye-watering 1.6 points per possession off opponent offensive rebounds. If the Dream want to fully flex their extra chance advantage, they’ll need to assert that no one makes them bleed their own blood.
Regardless, there is still a clear top three here: the Lynx and the Valkyries, propelled by their exceptional net points from turnovers, and the Dream, driven by their net second chance points. It’s also worth noting that the extra chance edge is a boon for almost all good teams in the W.
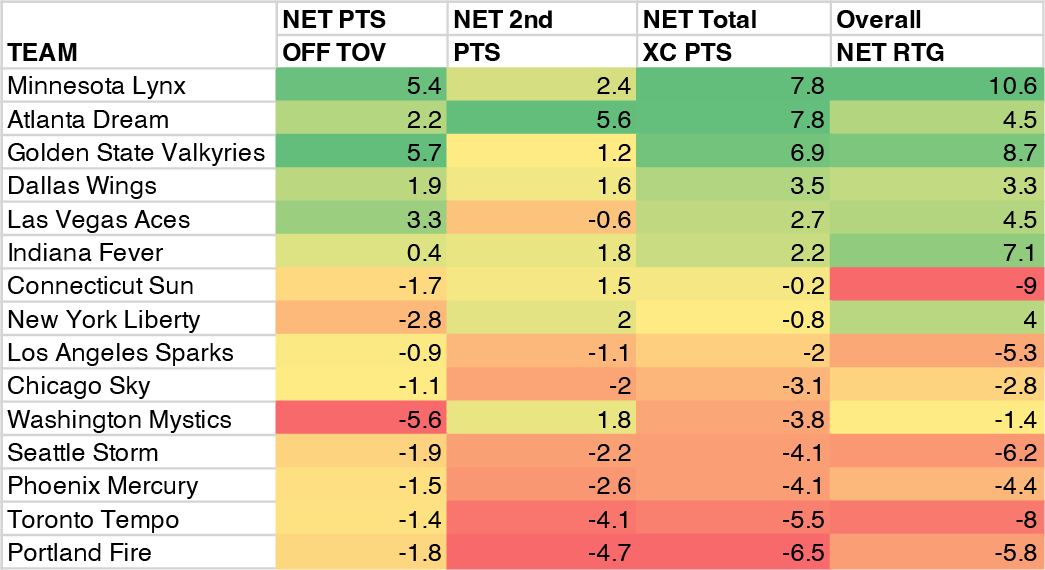
In a comparison between net extra chance points and net rating, what stands out is how much extra chance points seem to cover winning teams’ positive net ratings: the Dream and the Wings’ net extra chance points surpass each of their overall net ratings, indicating their extra chance point differentials give them the cushion to regularly win despite giving up points elsewhere on the margins. As for the Lynx, Valkyries, and Aces, their extra chance points cover the majority of their respective net ratings. Their playstyles and personnel may diverge, but their success shares this common thread.
On the opposite end, the New York Liberty stick out as the lone positive net rating team with both negative net extra chances and negative net extra chance points. This means that in an average game, their win condition entirely hinges on higher offensive efficiency as they must outscore opponents on fewer usable possessions. The Liberty have certainly shown the firepower to make this work so far, but is it sustainable for a deep playoff run?
We’ve gotten a good sense of who stacks up extra chances and who translates them into advantages, though the natural question follows: which players have been the most instrumental in helping their teams win the extra chance battle?
Because player stats don’t track individual matchup data, differentials in turnovers and offensive rebounds between players and their direct opponents are impossible to calculate. Instead, we will cobble together a rough idea of extra chance contribution by aggregating elements from each player’s statistical profile per 100 possessions.
Across WNBA’s official stats hub and Basketball Reference, there are six actions tracked at the individual level that are tied to extra chance creation. They are organized into the below table along with their relative worth in terms of extra chance value.
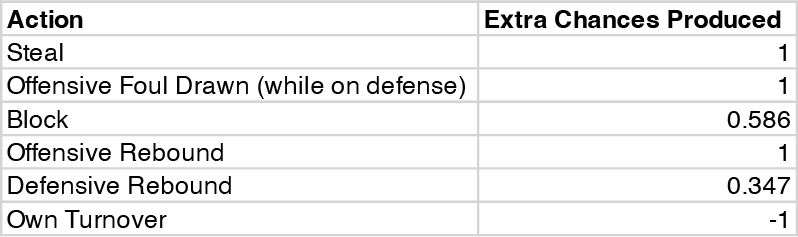
A few quick explanations on value. Steals are forced live ball turnovers, while offensive fouls drawn (such as drawing charges) are forced dead ball turnovers. In each case, the player is creating a new possession for their team before the other team finishes theirs, so these are one extra chance each. Own turnovers are the opposite, so minus one. Offensive rebounds, although categorized as extensions of possessions, also give teams an extra scoring chance, so plus one.
Blocks and defensive rebounds are assigned fractional value because these actions do not always constitute extra chances, but in some situations they do. Case in point: a block recovered by the defense or that triggers a shot clock violation brings about an abrupt change of possession just like a turnover.
After scraping play-by-play data since the all-star break, there have been 372 blocks: 207 of these were recovered by the defense and another 11 resulted in shot clock violations within three seconds without another shot attempt, so in total, 218 blocks out of 372 (58.6%) can be credited with a change of possession and subsequent extra chance.
Lastly, because we are assigning offensive rebounds an extra chance value of one, it is only fair to assign some measure of value to defensive rebounds. The amount of credit that is due for securing a defensive rebound is debatable in many ways, so to avoid a basketball version of quantum entanglement, we will keep it simple. The ratio of defensive rebounds to offensive rebounds gathered so far this season is 2.88-to-1. Therefore, if offensive rebounds produce one extra chance value, a defensive rebound will be 1 / 2.88, or 0.347.
An accurate record of how many opposing offensive rebounds a good defensive rebounder denies doesn’t exist, but an extra chance prevented for the other team is equivalent to an extra chance gained. So all in all, this ratio will work fine for rounding out our estimation of which players are producing the most extra chance value.
Finally, we acknowledge that blocks and defensive rebounds are incorporated into extra chance calculations in a way they were not at the team level, but this is our good-faith attempt to adapt extra chance creation to the individual level since things like dead ball turnovers forced (outside of offensive fouls drawn), in addition to the aforementioned offensive rebounds allowed to matchups, are not currently attributable per player.
With all this in mind, we pull player data per 100 possessions to normalize for pace, filter out those with inadequate playing time*, and convert the six actions according to their values to get an estimation of each individual’s extra chances created per 100.
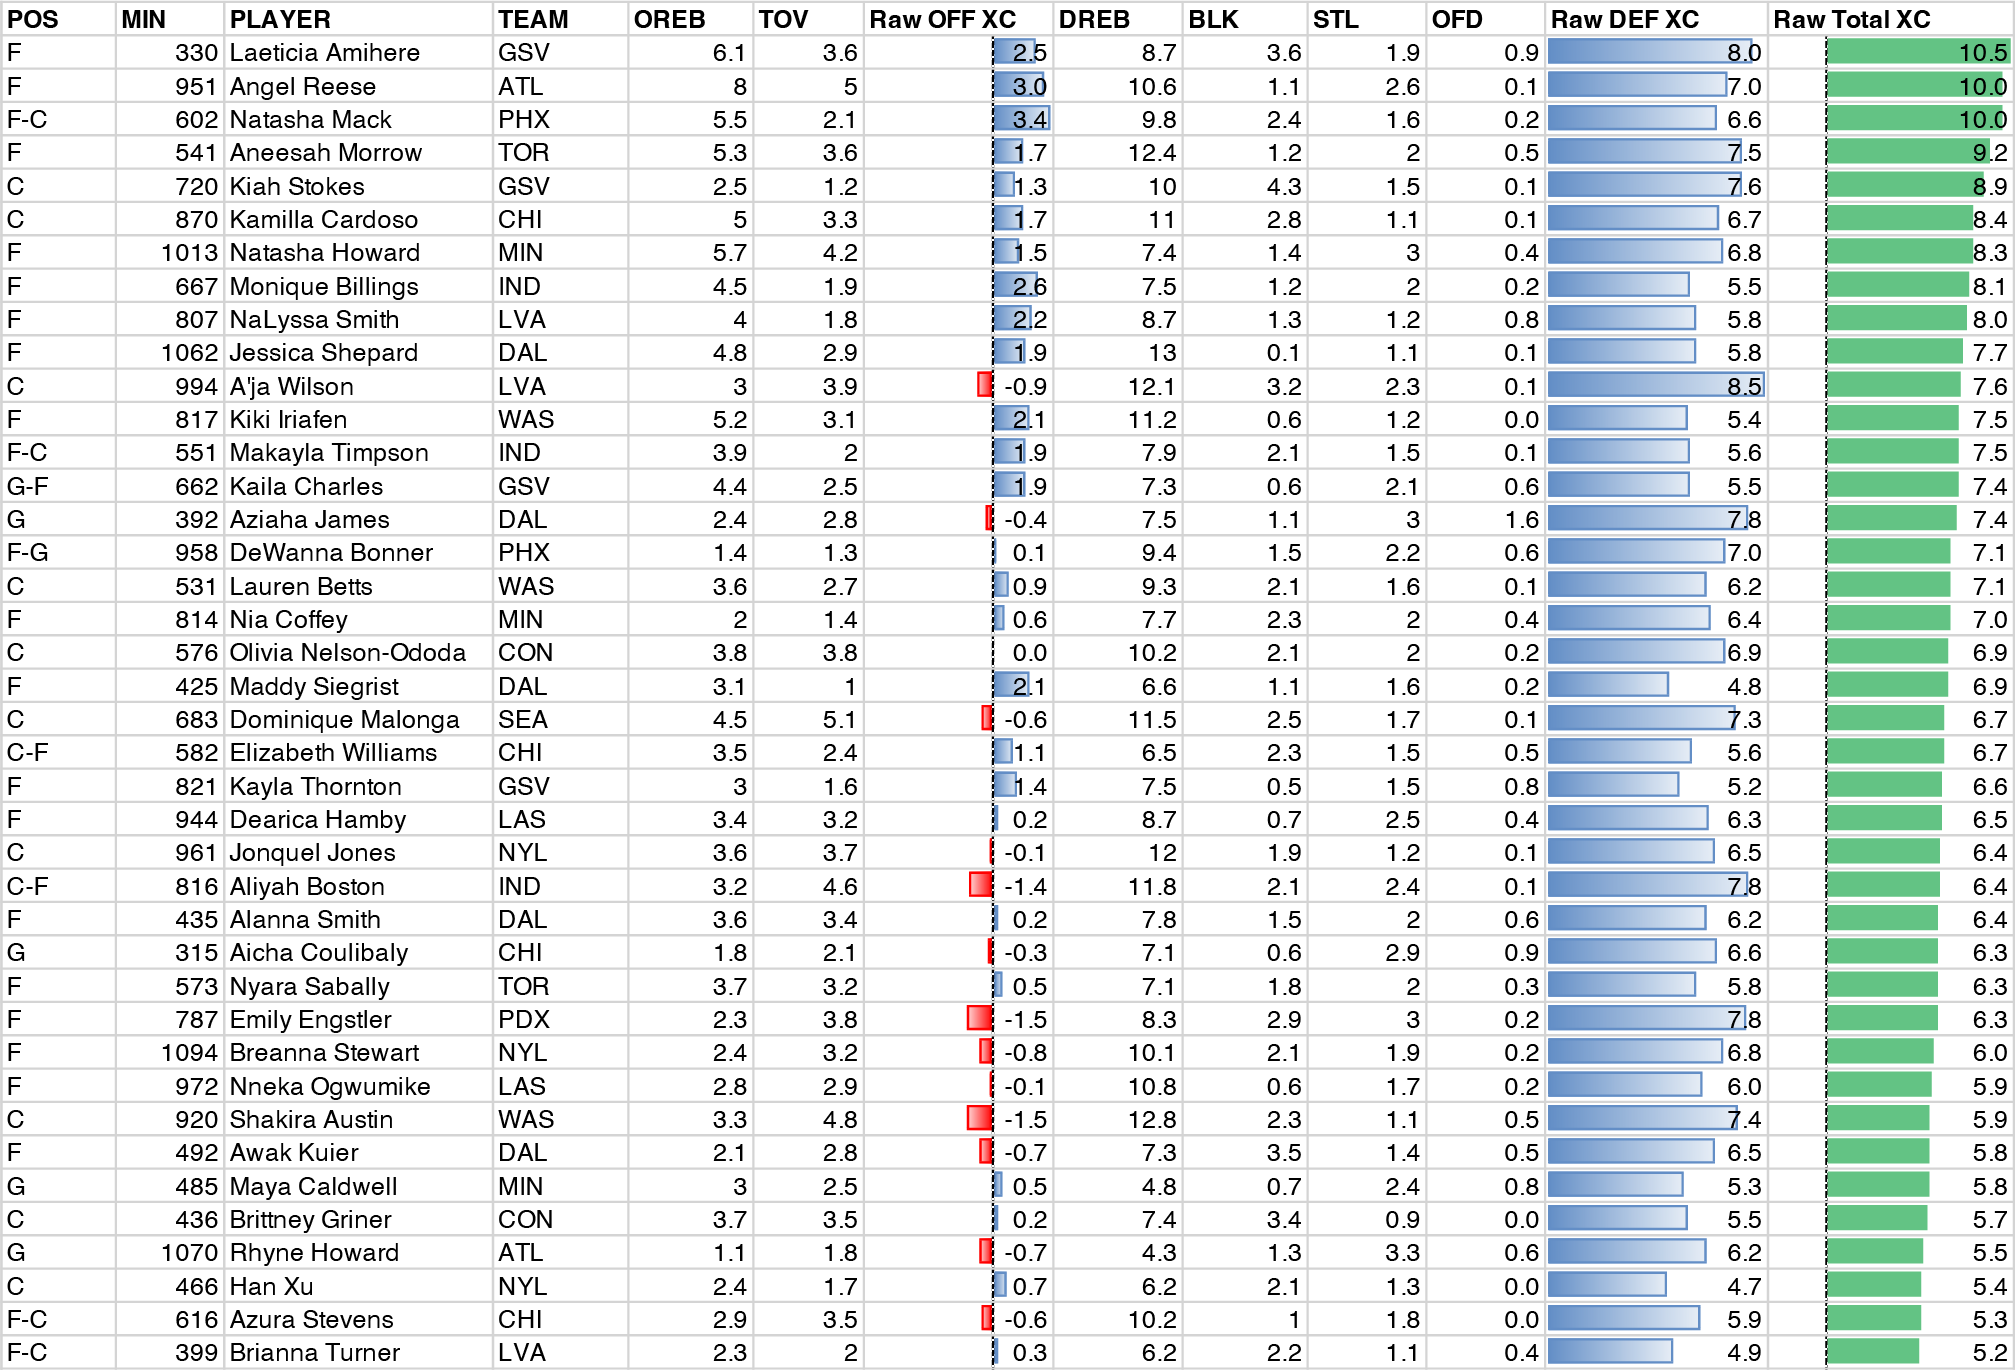
Top 40 Players, Total Extra Chances (XC) Per 100 Possessions, 311+ min played. Calculations were performed using full decimal values but box score stats and XC output rounded to nearest tenth.
This is an interesting list, comprised of role players with some big names sprinkled in. Before we analyze further, it may be useful to determine how many more extra chances top performers created relative to the average player.
So after weighting every player’s minute share and adjusting for pace, we can arrive at the league average extra chance output per 100 possessions.

So the average player leaks extra chances on offense but more than makes up for it on the defensive end. And so here again is the same list of top 40 XC creators but now with their net XC contributions relative to the average player.
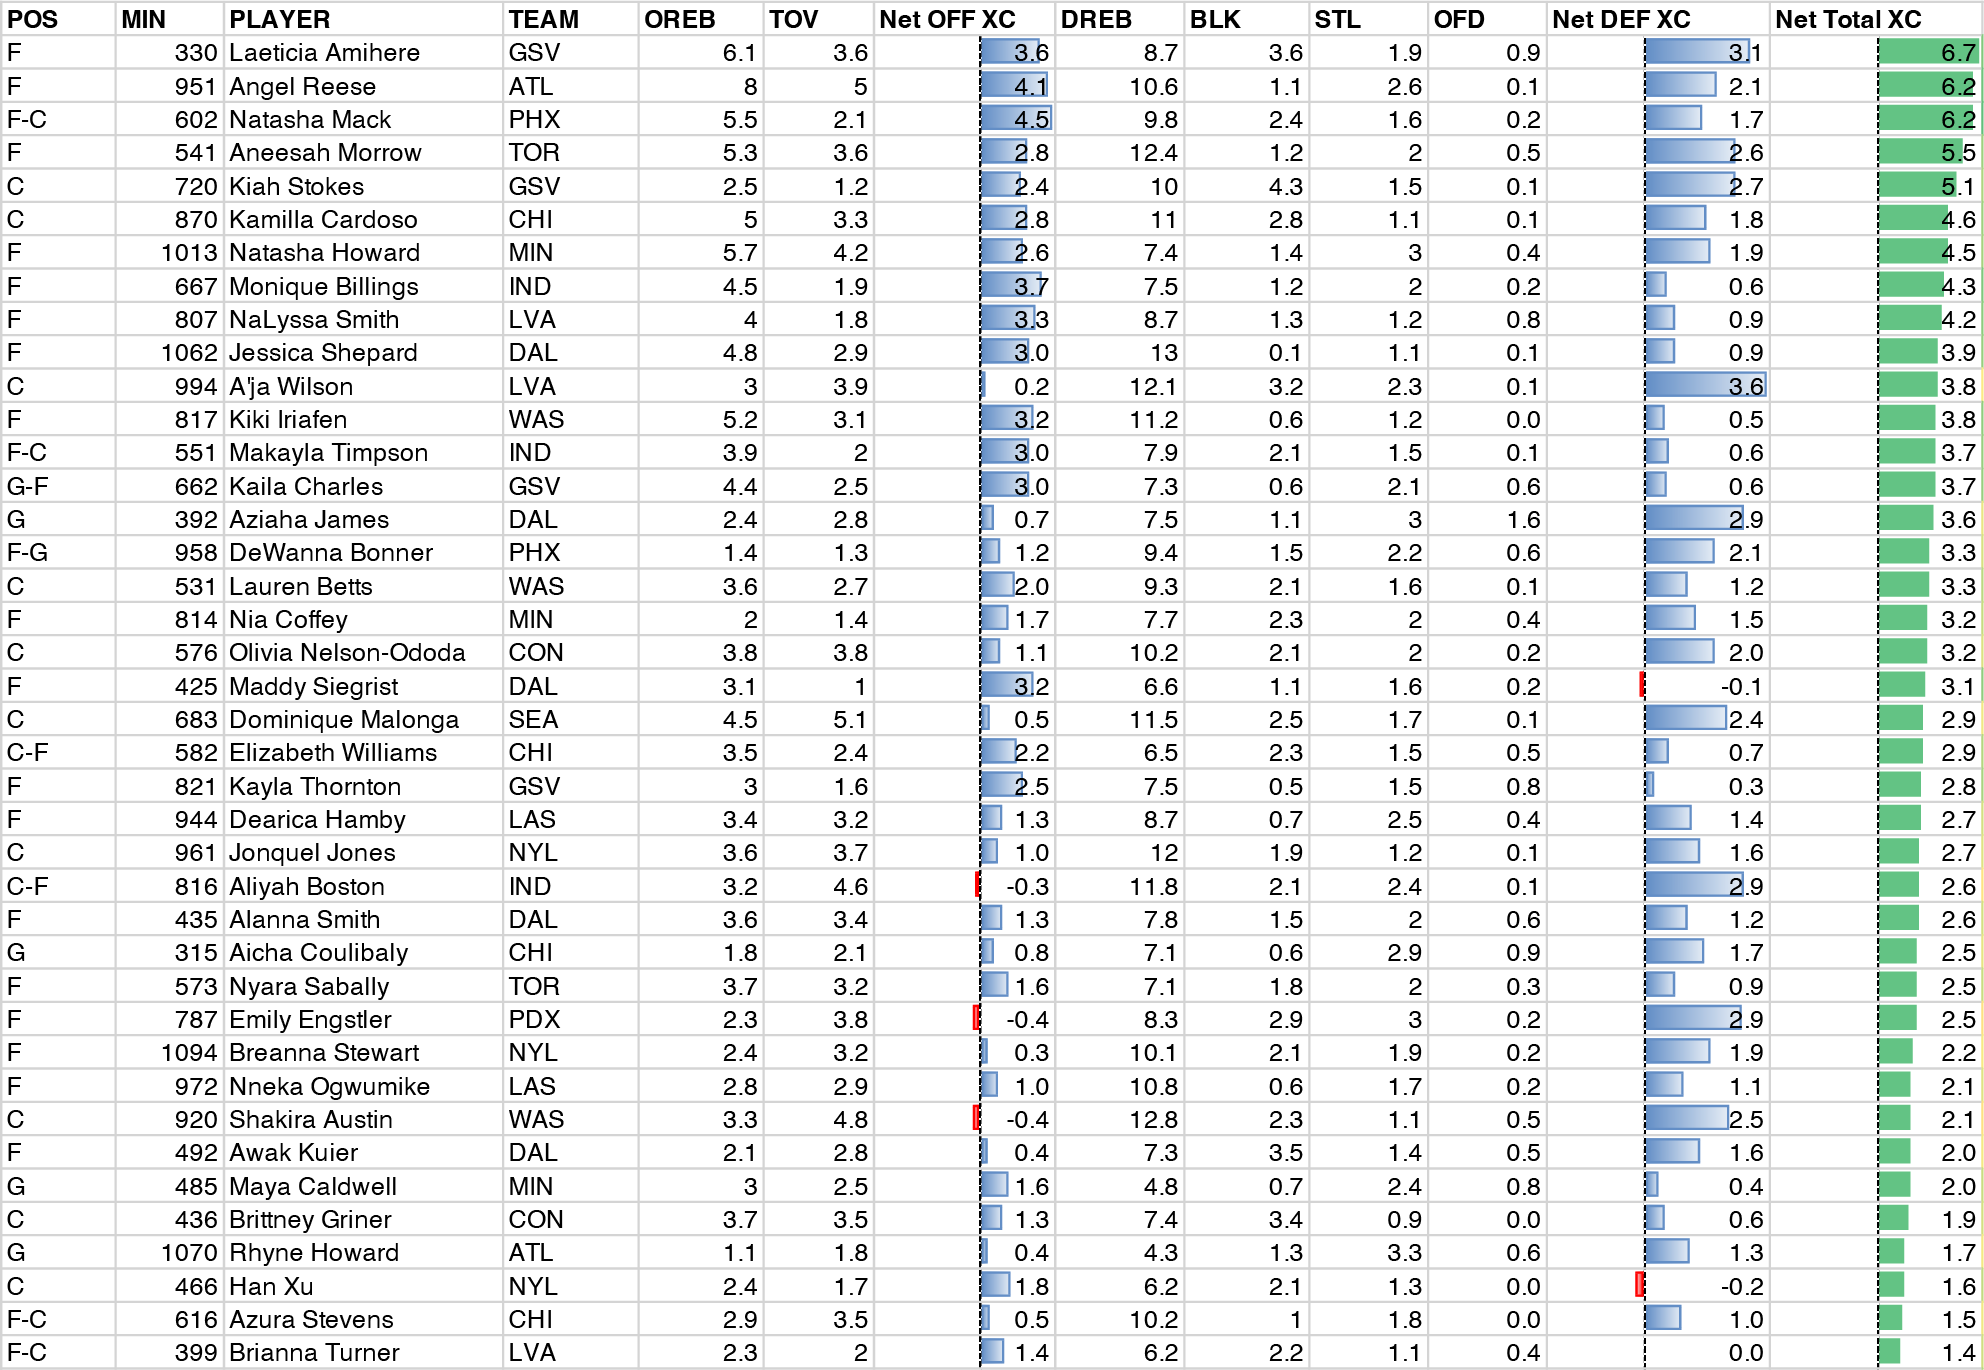
Top 40 Players, Net Extra Chances (XC) Per 100 Possessions, 311+ min played
Unsurprisingly, we are seeing some strong defensive players and rebounders, and size trends to the top with forwards and centers making up 35 of the top 40. Does this mean that size is integral for extra chance difference-making where a lot of value comes from ball control off the glass and in the paint?
Likely yes, but this snapshot doesn’t give grace to how guards typically shoulder heavier offensive loads and on-ball usage that inflate turnover exposure, while their perimeter-oriented roles leave them with less-than-ideal positioning for rebounds. But this is the push-and-pull of the game. Guards generally bear the responsibility of creating offense (points, assists) and directing effective possession usage, while forwards and centers try to create extra chances for the team to work with.
Because of this, many premier guards fall below league average in extra chance creation: Paige Bueckers (-1.9 Net XC), Jackie Young (-2.2 Net XC), Olivia Miles (-2.7 Net XC), Kelsey Mitchell (-2.9 Net XC), Kahleah Cooper (-3.6 Net XC), Marina Mabrey (-4.2 Net XC), and Caitlin Clark (-6.3 Net XC) were named all-stars this season, and all of them fell into the bottom quartile of XC creation.
At the same time, this might speak to the immense value of star forwards and centers, who are the rare archetype of player that not only boost scoring and shot creation on offense but provide utility as extra chance generators when they don’t have the ball in their hands. Despite leading the league in scoring (26.3 ppg) and usage rate (32.3%), A’ja Wilson is the best defensive extra chance creator in the league. Meanwhile, Jessica Shepard, even as she’s flourished as the Wings go-to playmaker and scorer in the frontcourt, has cemented herself as a top 10 extra chance creator through her prolific rebounding on both ends. Shepard and Wilson are world-class chefs that literally source their own ingredients.
But the reality remains: most of the names on this list are role players, which makes sense. Extra chance generation ultimately measures how well players who don’t have the ball go out and get it for their team. And for those that aren’t tasked as primary playmakers and shotmakers, getting the ball back however, whenever, is perhaps the most impactful thing they can do.
All in all, there were 60 qualified players that were net positives in extra chance creation relative to league average. The Dream, the team that generates the most net extra chances per 100, somehow roster the fewest net positive XC creators at just two. It appears the Dream’s extra chance stockpile is built largely through Angel Reese’s supremacy on the boards and Rhyne Howard’s league-leading thievery.
In contrast, the Valkyries, the league’s second-greediest extra chance collector, clocks in with seven net positive XC creators, the most of any team. And it’s not just the role players; the Valkyries’ top three scorers—Gabby Williams, Janelle Salaün, Veronica Burton—are part of the net positive gang. While other teams tend to specialize the dirty work, the Valkyries are practically a janitors’ union.
Before we wrap up, because extra chance creation is often influenced by role and position, it seems only fair to show net XC creation relative to positional average as well.

As intuition would have it, the standard for extra chance creation rises from guard to forward to center, but still, it is interesting to see who shines among positional peers.
Here are the top 10 net XC creators at each position—first guard, then forward, then center.

Top 10 Guards

Top 10 Forwards

Top 10 Centers
Feel free to peruse each group, but two things seem notable. First, a Valkyrie role player leads every position—Kaila Charles at guard, Laeticia Amihere at forward, and Kiah Stokes at center. This again speaks volumes about the strength in numbers and “empty the tank” culture that the Valkyries have established. Second, because the bar for generating extra chances is highest at center, more than triple that for guards, it is difficult for bigs to outproduce the mean and offer considerable relative value at the position.
One Final Thought
Extra chances are created in the trenches. Even though they are critical for situational advantages and the overall possession battle, prying balls loose and boxing out with authority are lunch pail regularities that don’t often incite oohs and aahs. Headlines instead pull focus on hot shooting nights and scoring outbursts.
But what about the off-nights—the games when players seem more likely to catch colds than catch fire, when shots that usually drop in, roll out? Shooting variance, particularly on 3-pointers, has been well-documented to have an outsized impact on the outcome of games.
This is where extra chance points come in handy. In a basketball economy where the 3-point line is increasingly relied upon, teams that regularly outdo their opponents in extra chance points can afford more shooting variance. They can miss more from three and still maintain neutral to favorable win conditions.
To get a better sense of what this buffer looks like, we take each team’s 3-point shooting stats per 100 possessions and calculate their binomial distributions and variances using 3PM as successes (k), 3PA as trials (n), and 3P% as probability (p). The table below shows the percentile within each team’s 3-pointer probability distribution required to offset average net extra chance points. In other words, for teams with net positive extra chance points, this marks the percentile where 3-pointers made below expectation offset their extra chance advantage. For teams with net negative extra chance points, this marks the percentile where 3-pointers made above expectation offset their extra chance disadvantage.
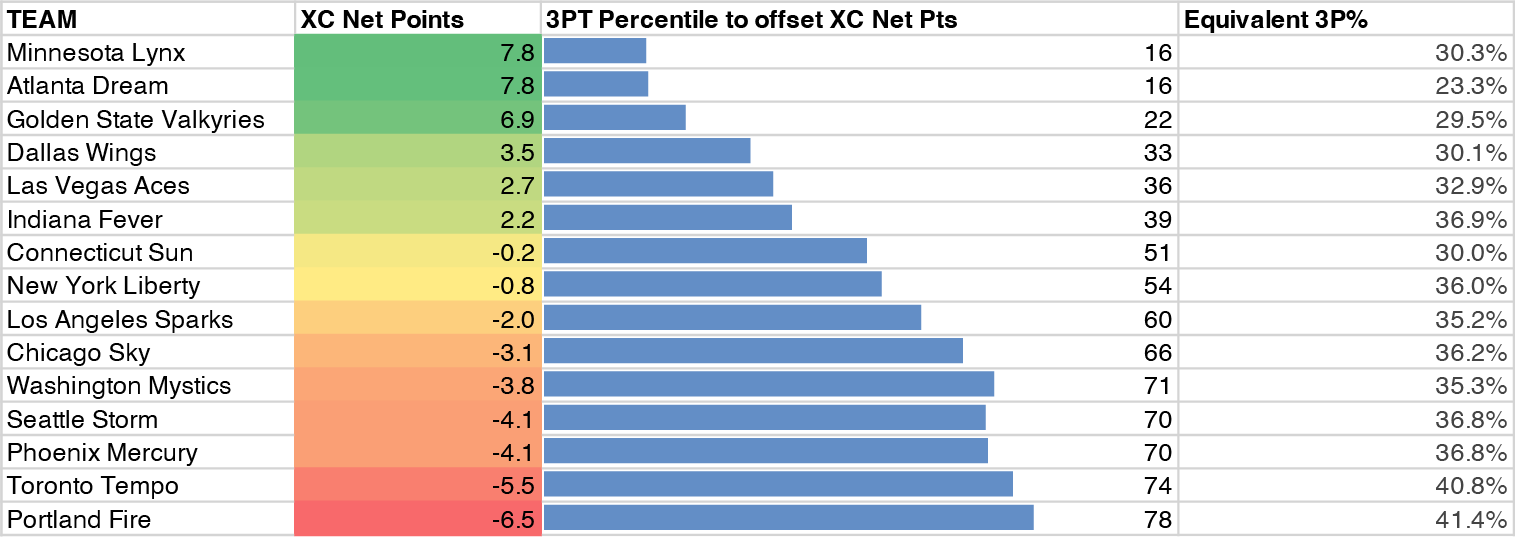
Each team’s 3-pointer distribution and variance are calculated using their own 3PM (k), 3PA (n), and 3P% (p), per 100 possessions.
From this exercise, it’s apparent that net extra chance points leaders like the Lynx, Dream, and Valkyries have accrued considerable leeway before poor 3-point shooting negates their average extra chance edge. The Lynx and Dream need to stumble to 16th percentile 3pt shooting nights—for the Lynx this means shooting 30.3%, and for the Dream this means just 23.3%, a borderline brickfest. Not far off, the Valkyries need to struggle to a 22nd percentile 3pt shooting night, the equivalent of 29.5%.
On the opposite end, the Portland Fire need to have a 78th percentile 3-point shooting performance, the equivalent of 41.4% from deep, to make up their net XC point deficit. It’s a make or miss league, but certain teams put a lot less (or a lot more) pressure on themselves to be accurate to keep the playing field level.
When the playoffs begin, we know what will happen. The intensity skyrockets, defenses lock in, previously open shot windows slam shut. Scoring efficiency dips across the board.
And so which teams will be resilient come October? Those that give themselves the most chances to fail may be the most likely to succeed.
All stats pulled from stats.wnba.com, basketball-reference.com, or inpredictable.com. Team and player metrics are from 05.08.26 to 08.12.26.
*To qualify, players needed to have played at least the equivalent of 25% of minutes for the team with the fewest minutes logged this season (Connecticut Sun at 1245), i.e. 311+