
How Much Top Offenses Play Efficiency Ball
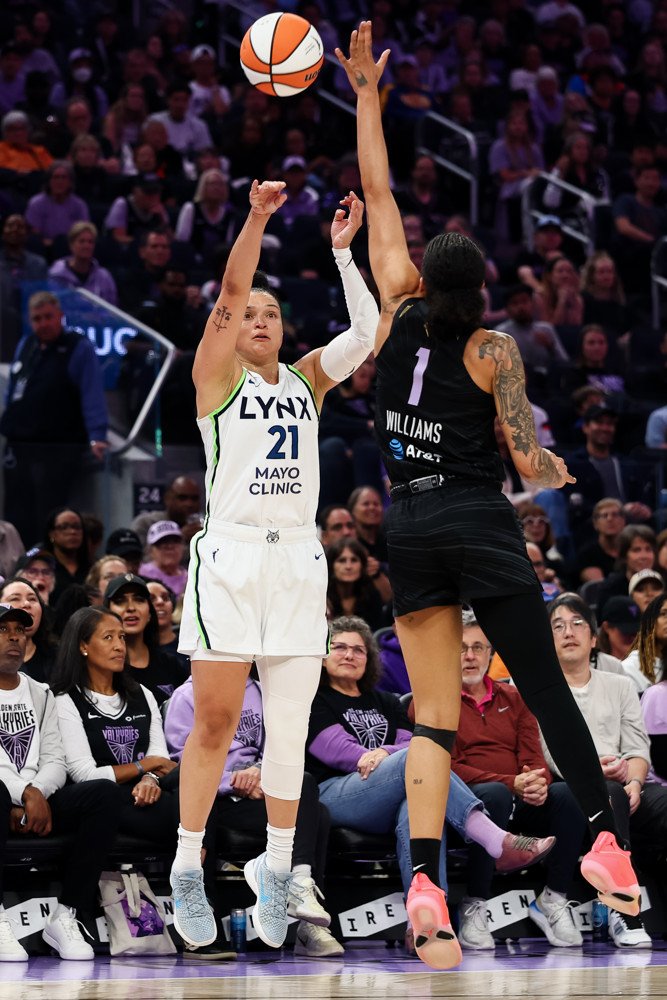
Kayla McBride keeps her threes clean and free of fillers and added distance. | Photo by Trinity Machan/Icon Sportswire
It’s raining buckets. The WNBA is enjoying its greatest offensive season ever. The Indiana Fever lead the league with a 114.2 offensive rating (points scored per 100 possessions AKA OFFRTG), which if holds, would clock in as the best in WNBA history. But the Fever are in good company: so far this season, five teams average over 110 OFFRTG (Fever, Aces, Lynx, Wings, and Dream), and only two other squads in the league’s 30-year span have surpassed this mark before (Aces in 2023, Mystics in 2019). This has helped boost the league average OFFRTG to 107.3, which would, yet again, be a new record.
What’s boosting these offenses? It’s not pace since OFFRTG is adjusted per 100 possessions, so it must be efficiency related. And what more fundamental way to examine this than shot selection?
In 2026, much of professional basketball has gone from wading through analytics to full submersion in them, and a game behind the game has emerged. Teams are trying to win with math in addition to personnel and coaching. One of the most distinct “theorems” behind this is the idea of taking the most statistically favorable shots: 2-pointers near the rim (and free throws) for high conversion rates and 3-pointers for their value. This has gone by several names, though popularized early as “Moreyball,” a moniker formed after former GM of the Houston Rockets, Darryl Morey, and his philosophy on prioritizing layups/dunks, 3-pointers, and free throws above all else.
But in the spirit of democratizing the term, we’ll use the term “Efficiency Ball” to describe this concept. So with the WNBA amidst its hottest offensive start in league history, which teams are leaning into Efficiency Ball the most?
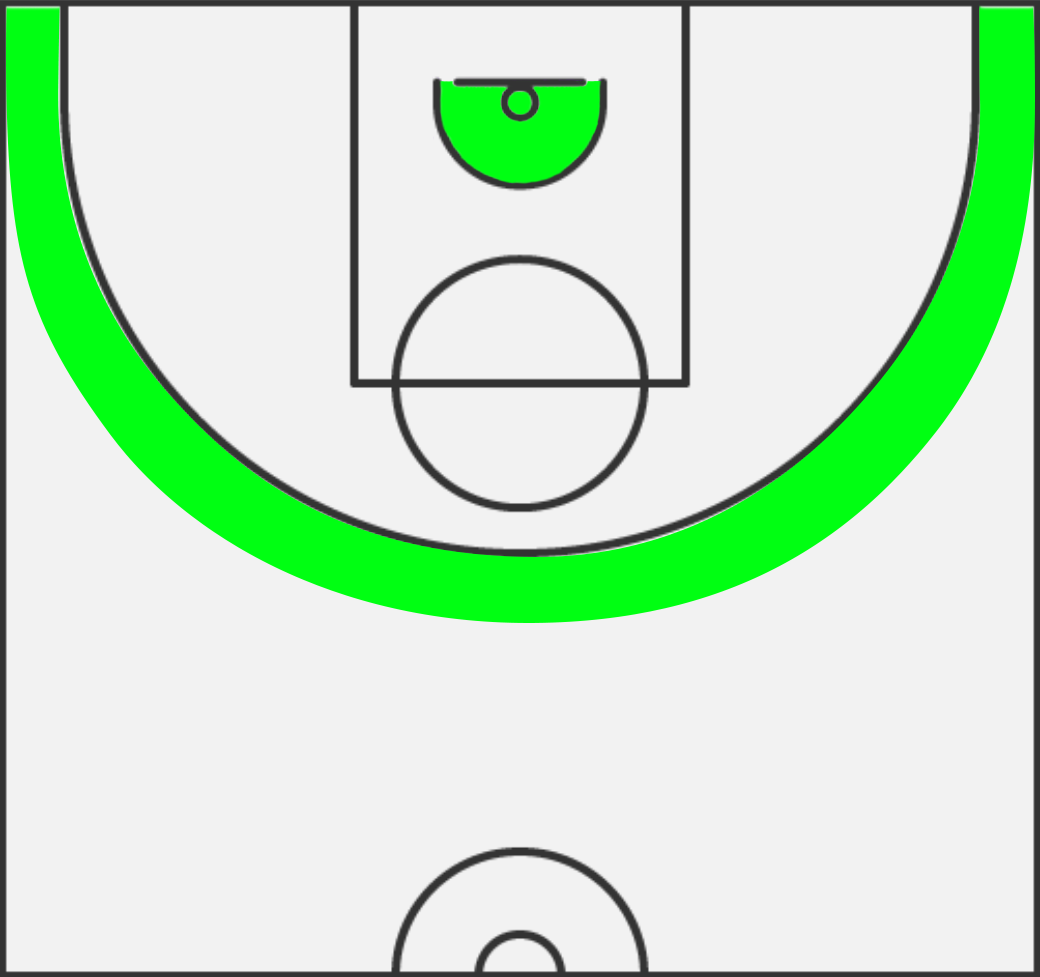
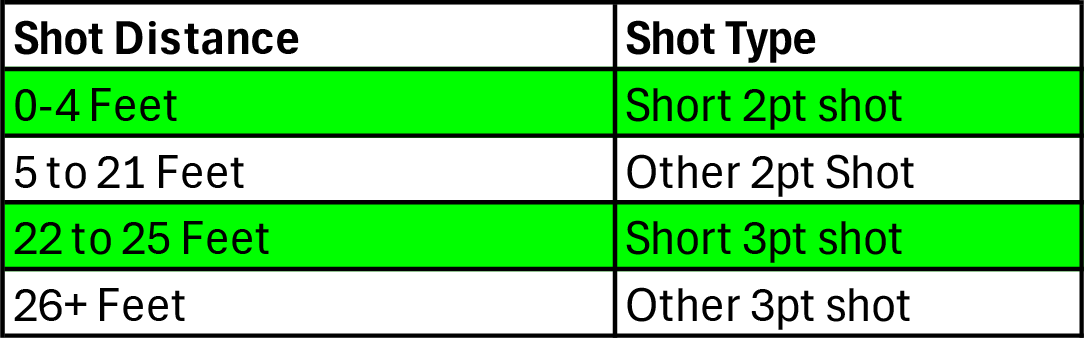
Let’s start with defining Efficiency Ball shots. What are at-rim 2-pointers? To keep things simple, we’ll mark this as any shot taken in the restricted area which spans four feet radially from the center of the net. As for 3-pointers, the standard qualification in Efficiency Ball is ANY 3-point shot. But if the idea is to take the easiest shots relative to their value, then this principle should also apply to 3-pointers. The difficulty of a shot increases at a faster than linear rate as the distance increases (via shrinking margins of error in launch angle, arc, velocity, etc.), so each step back behind the 3-point line actually reduces shooters’ chances more than an equivalent step back from the inside the arc. Ultimately, the goal is to keep the definition simple here too, so any 3-pointer up to 25 feet away, the absolute furthest a corner 3-pointer could be taken if a player could shoot with all but their toes off the ground, will be classified as a short three.
To summarize, this is how shots will be categorized. Two-pointers taken within the restricted area will be considered short twos, and 3-pointers taken within 25 feet of the hoop will be considered short threes. These will be the sources of Efficiency Ball attempts.
Free throws are the last of the trinity of Efficiency Ball, but due to noise in how free throws are earned (intentional fouls, penalties like three-second violations, technicals, etc.), we will set these aside and focus solely on the types of twos and threes taken by each team.
So with the criteria set and the focus bounded, here are the Efficiency Ball attempt rates for each team thus far in the 2026 season.
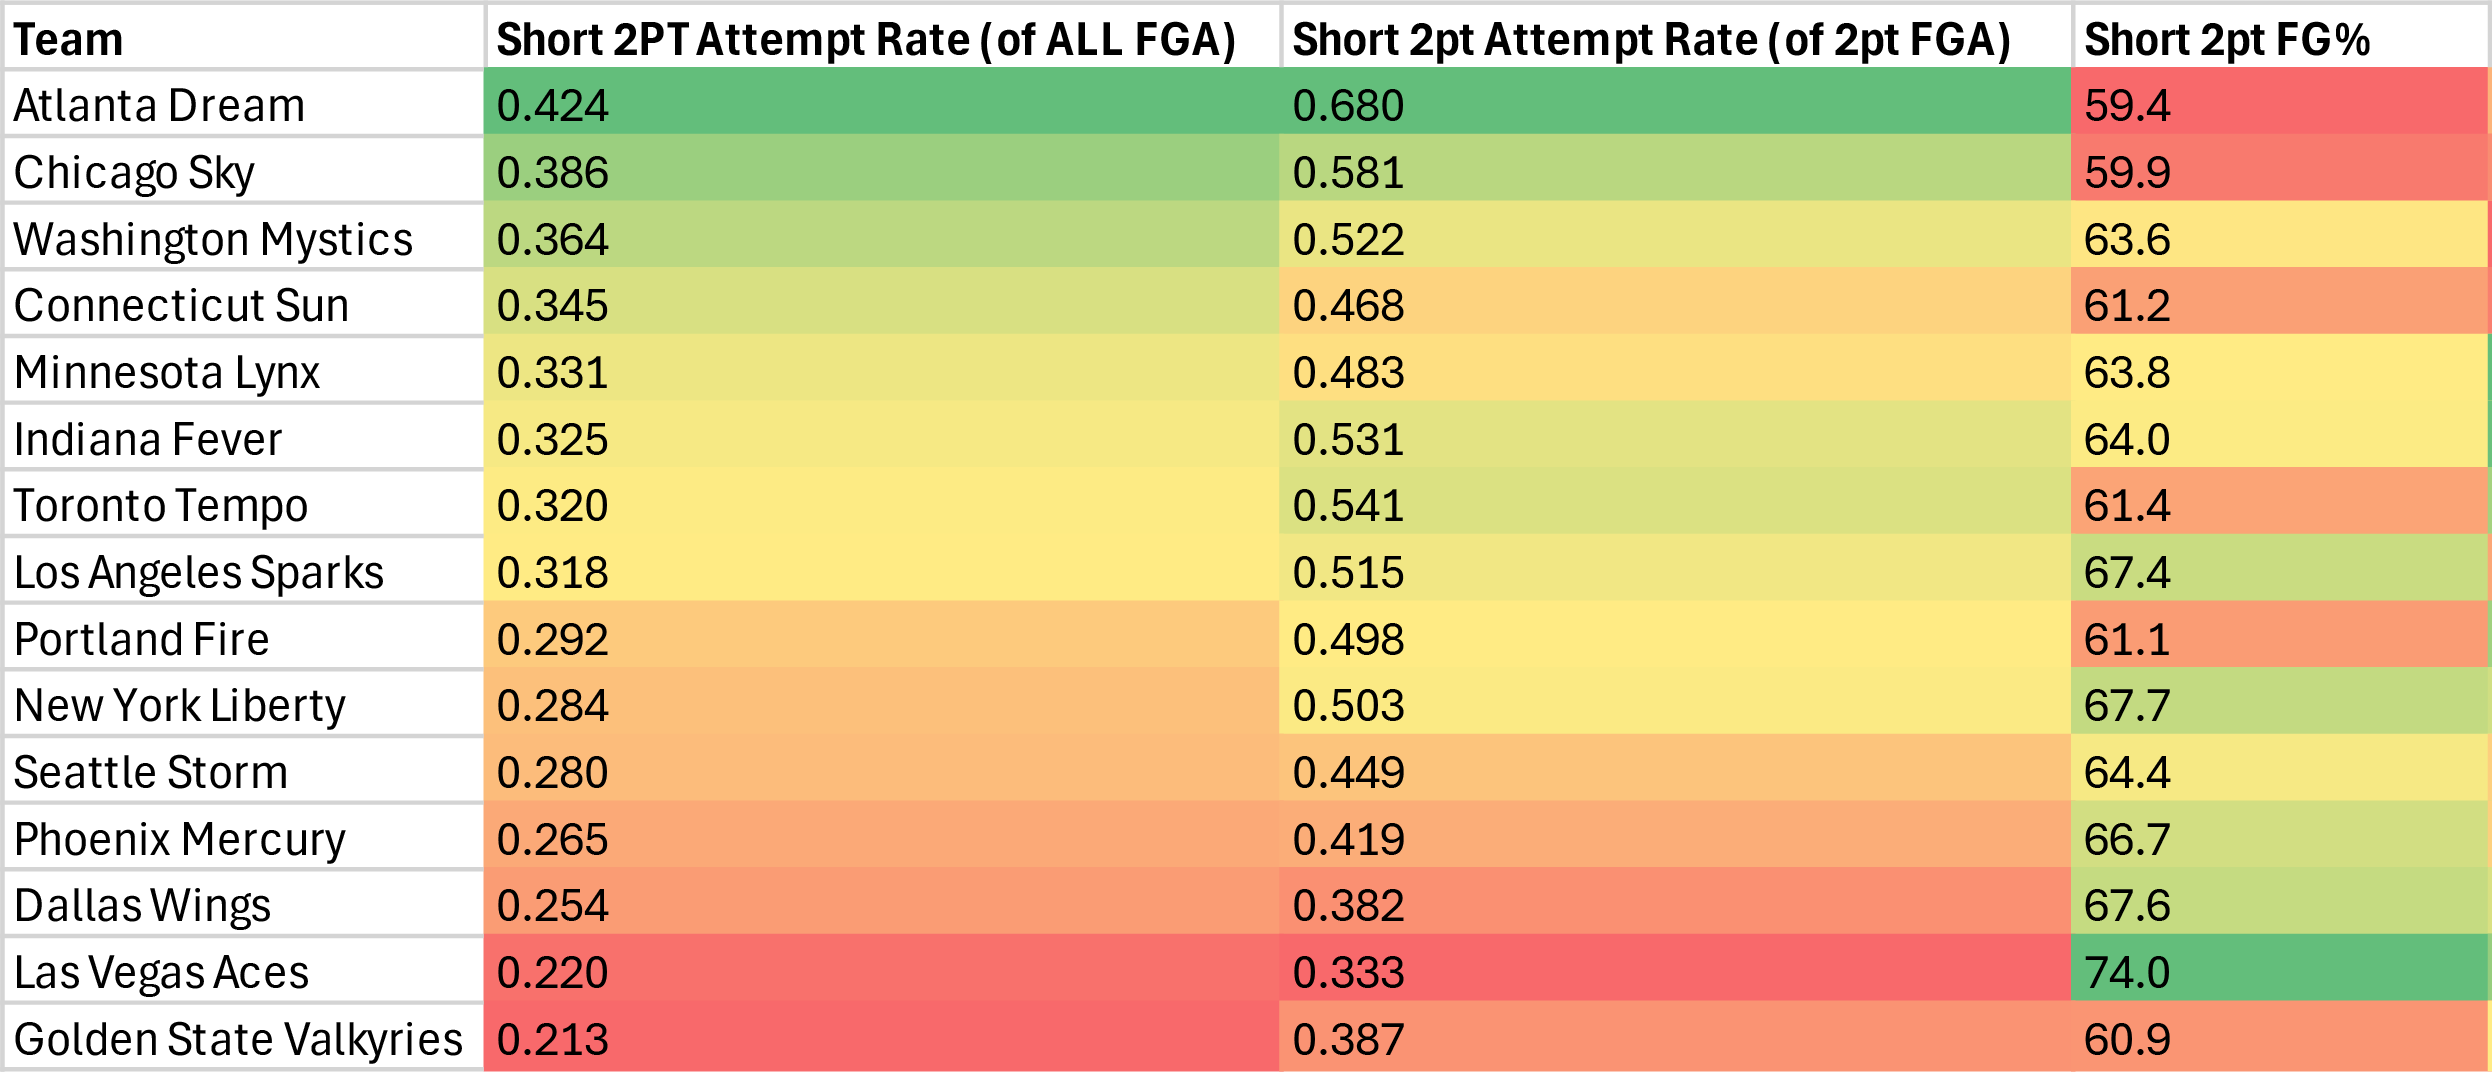
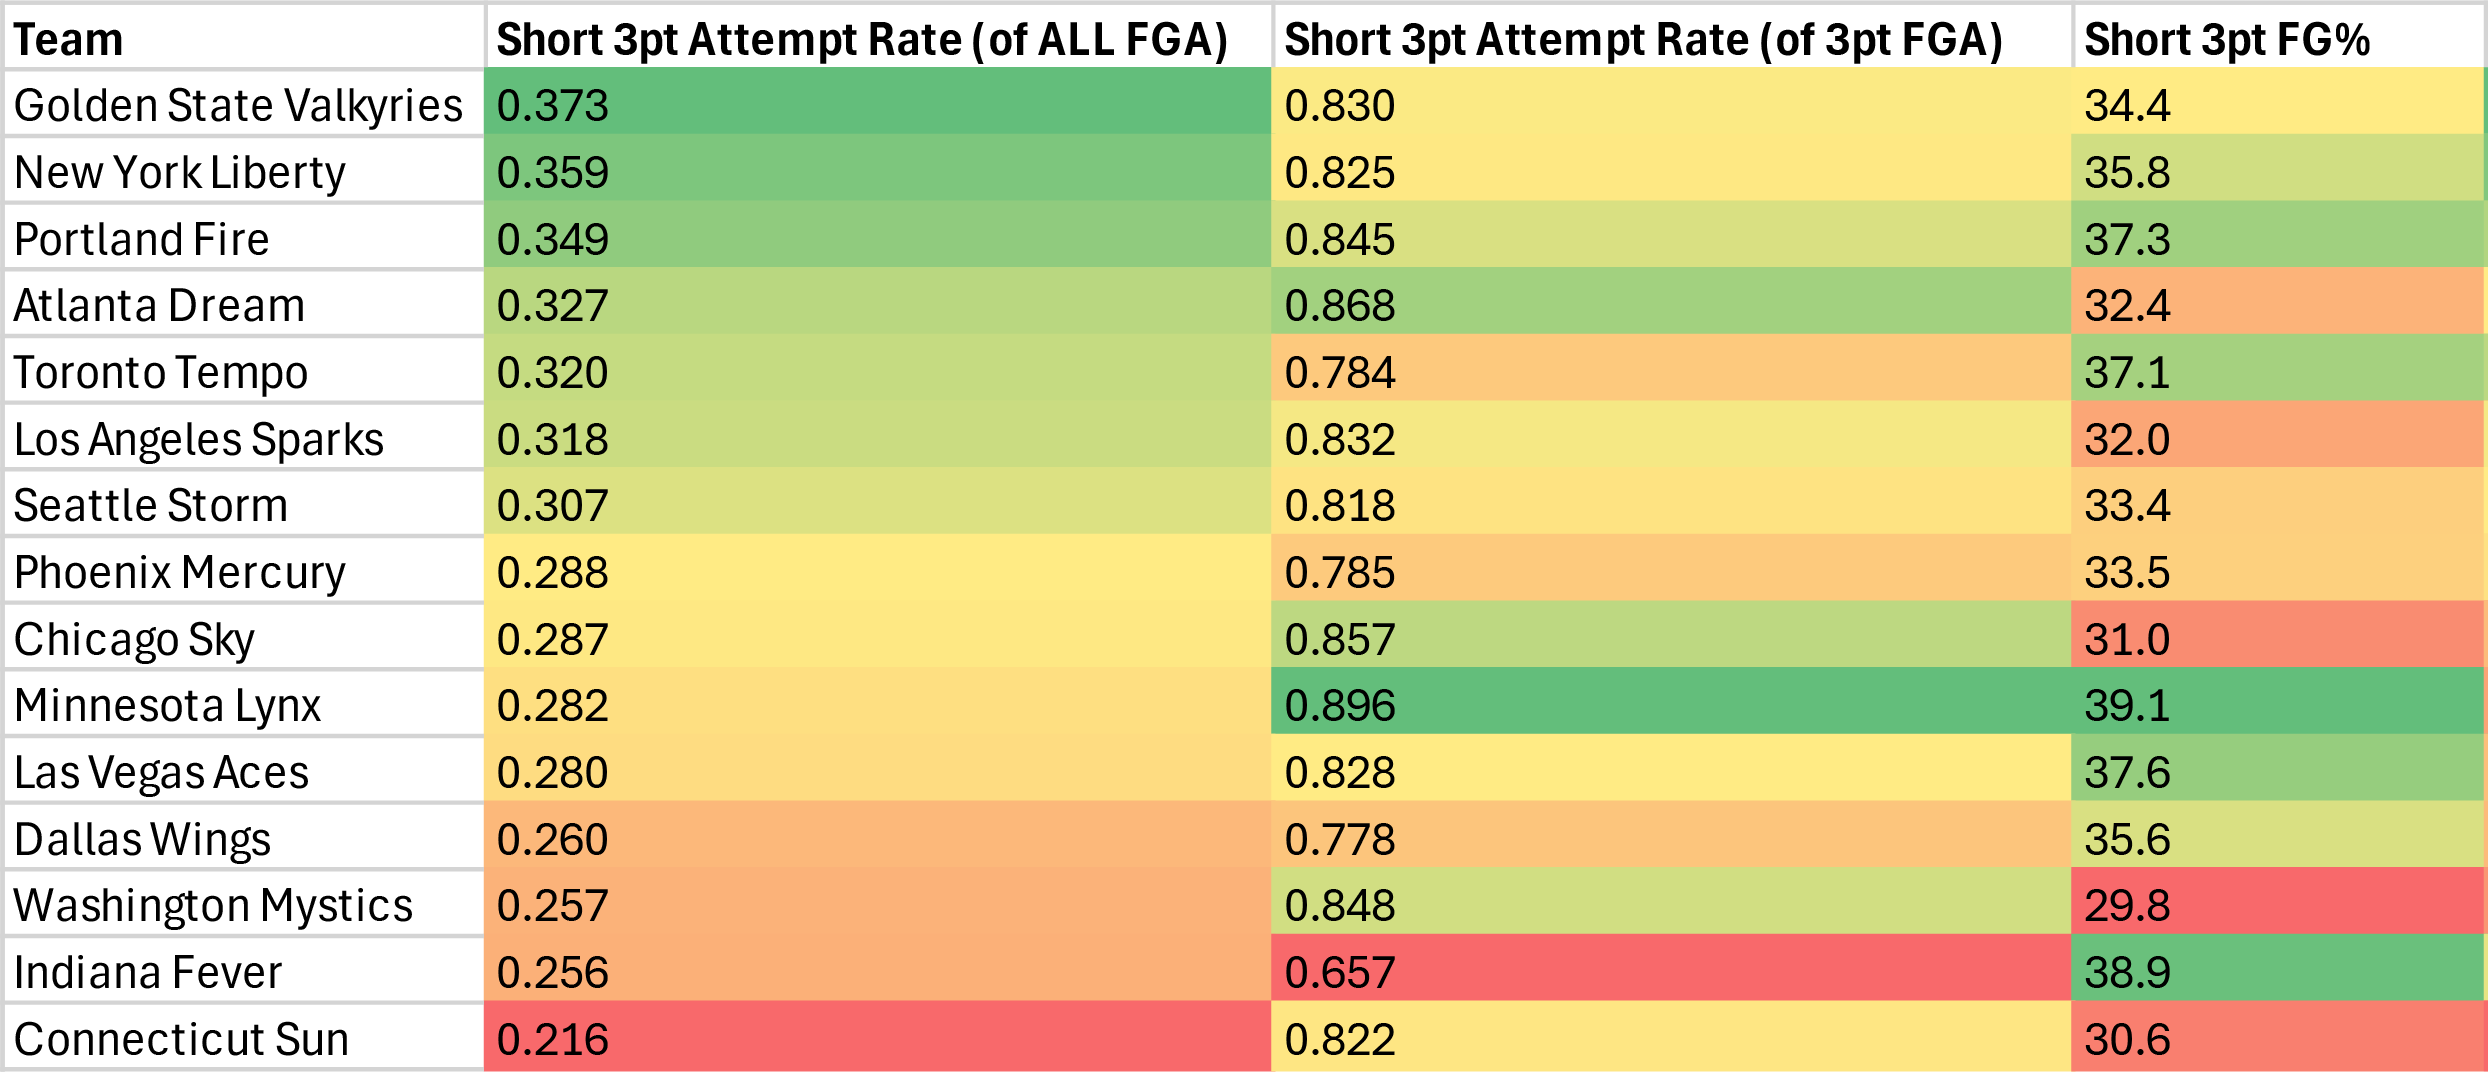
*a 0.3 attempt rate would mean 3 of 10 shots were of this shot type.
What immediately jumps out is a tale of two extremes. The Atlanta Dream attack the rim the most but struggle the most at finishing once they get there. The Chicago Sky experience a similar affliction as the second-most prolific rim attempt hunters but the second-least successful in converting on their opportunities. Both teams feature power post players—the Dream with Angel Reese and the Sky with Kamilla Cardoso—so it makes sense that their teams gameplan around their strengths. Reese and Cardoso do get their chances: they attempt the first and second most restricted area shots in the league. But Reese converts only 49.1% of at-rim attempts, a full 14 percentage points below the league average of 63.2%, while Cardoso manages an above-average 64.6%. Both squads have deliberate inside-out scoring identities, though one has an efficiency problem because of their star big and the other has one despite of her.
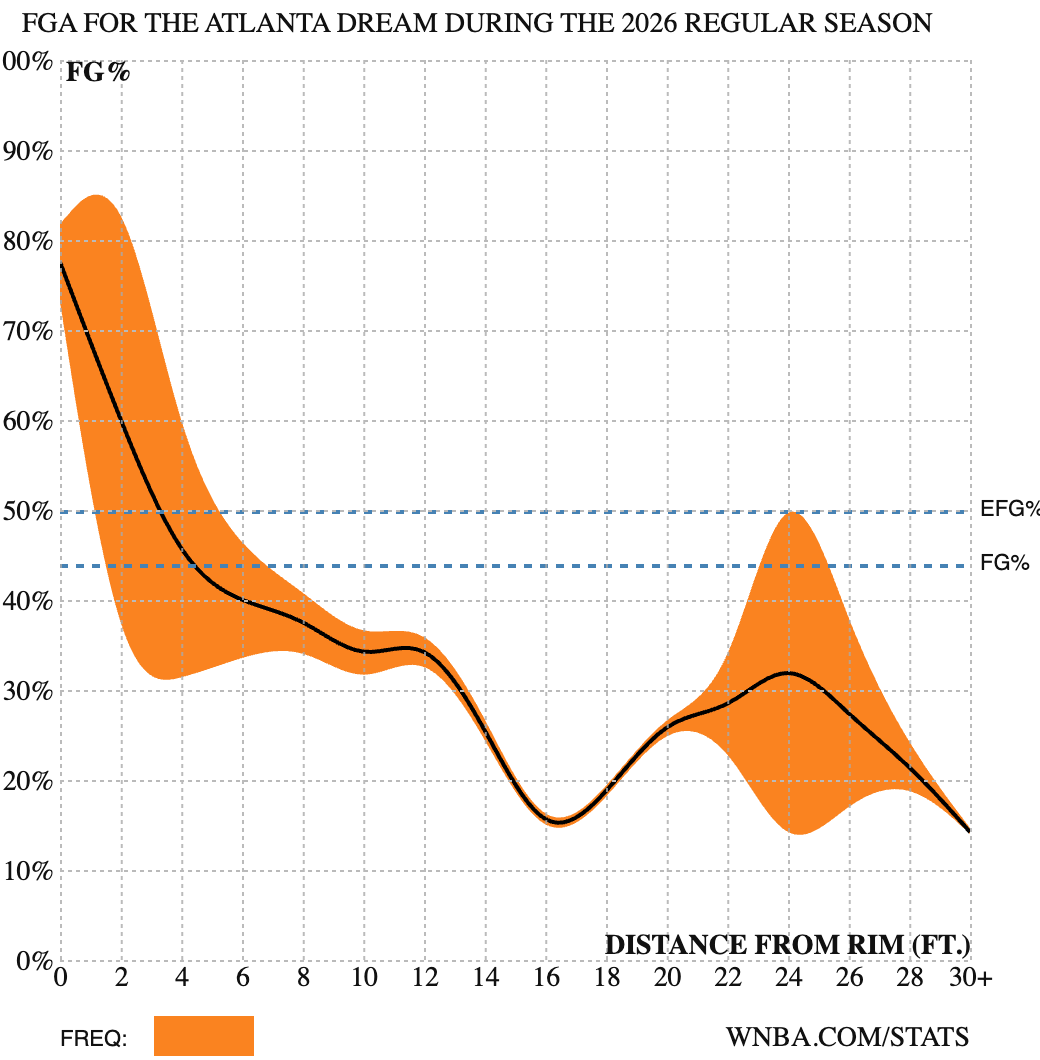
Shot stream for Atlanta “Efficiency Ball” Dream.
Meanwhile, the Las Vegas Aces and Dallas Wings take very few rim attempts relative to the rest of the league (bottom three) yet lead the way in efficiency in this area. These teams are relatively content to take skill shots in the extended paint and pop midrange jumpers. Part of this is unlocked by personnel: the Wings have budding midrange maestros in Bueckers and Fudd, and the Aces are buoyed by a dynamic duo of Wilson and Young. These medium-to-long 2-pointers are ones their stars are comfortable making and they have the greenlight to take them.
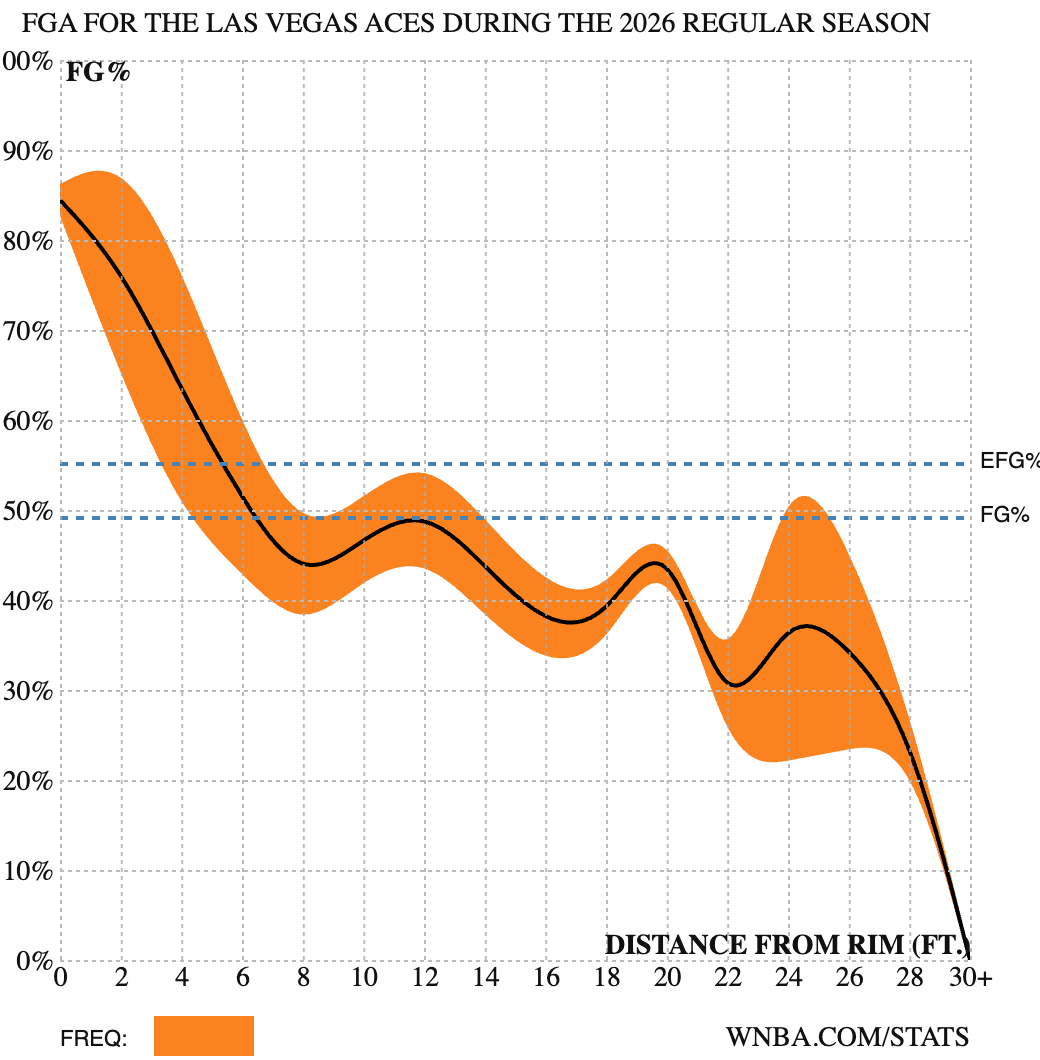
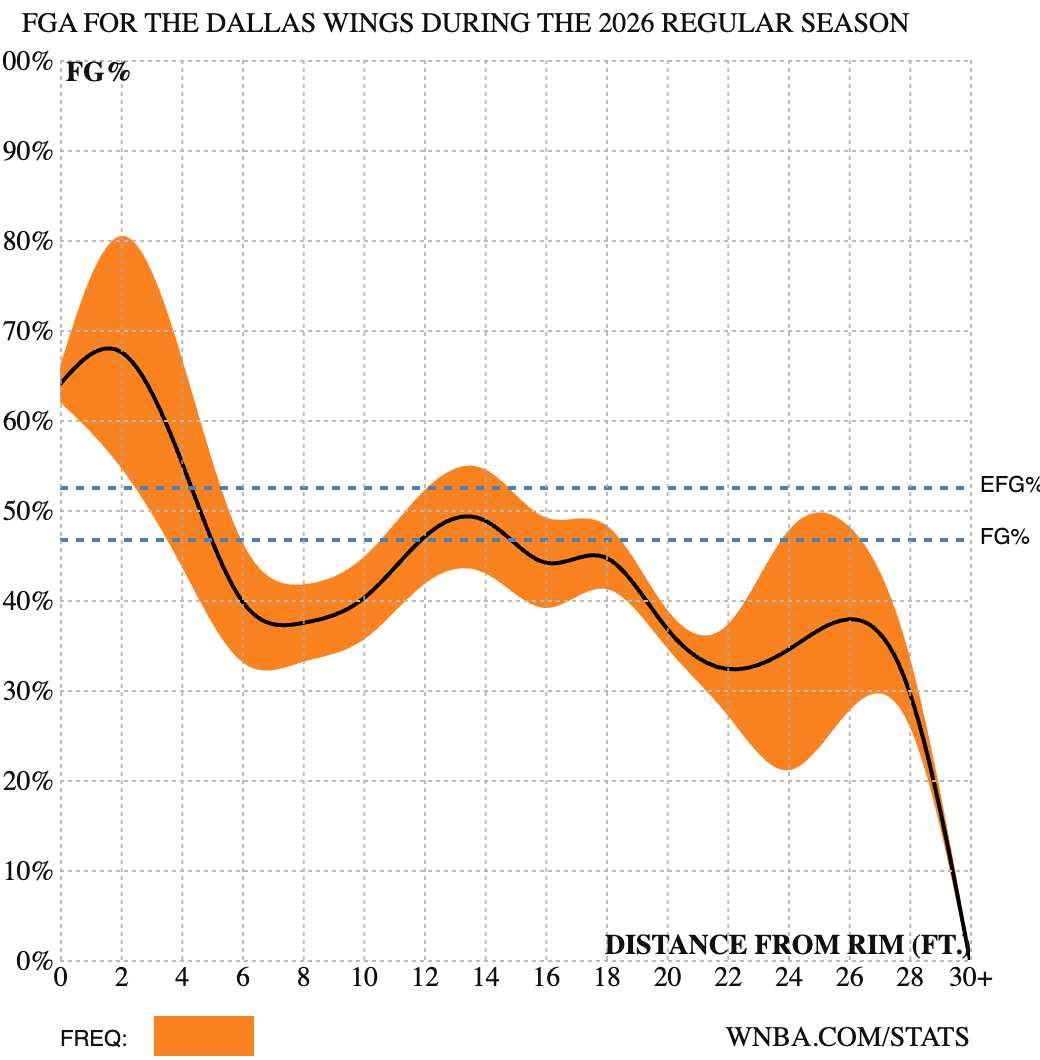
However, when these teams do reach the heart of the paint, they are led by some of the most accurate finishers in the league. Jessica Shepard’s 73.5% in the restricted area powers the Wings’ low post attack, while the Aces are again headlined by A’ja Wilson and her interior dominance but also NaLyssa Smith’s putback prowess and their respectively obscene 80.6% and 77.5% conversion rates.
As for short 3-point attempts, the top teams in overall 3-point attempt rate (Golden State Valkyries, New York Liberty, and Portland Fire) equivalently lead the pace in short 3-point attempts, so nothing revelatory here. However, it is interesting to see how the two most accurate 3-point shooting teams, the Indiana Fever and the Minnesota Lynx, take starkly different approaches on their launch points. The Fever play to spray, letting it rip from extra deep at an outlier rate of more than one out of every three attempts. But this isn’t rash behavior, it makes total sense. Their highest volume 3-point shooters, Clark and Mitchell, are on-ball creators who take longer rhythm pull-ups, and their league-leading proportion of unassisted 3-pointers (21.6%) demonstrate their abilities to conjure sauce-based threes from scratch. Clark, unsurprisingly, decadently dines on deep dish threes, as 108 of her 174 her 3-point attempts (62.1%) have come from 26 feet or further out. Clark and Mitchell have helped the Fever rebrand a typical no-fly zone into a splash mountain.
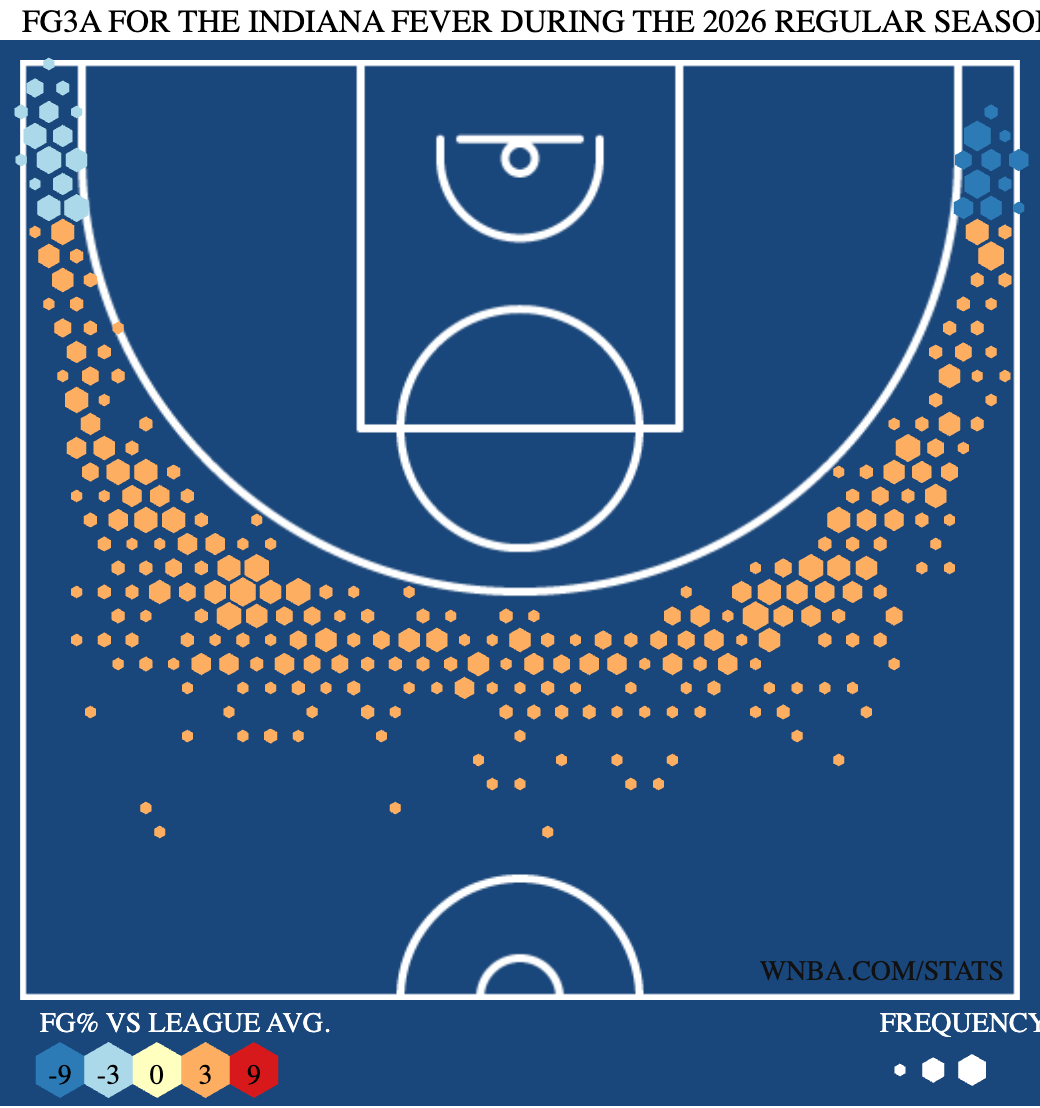
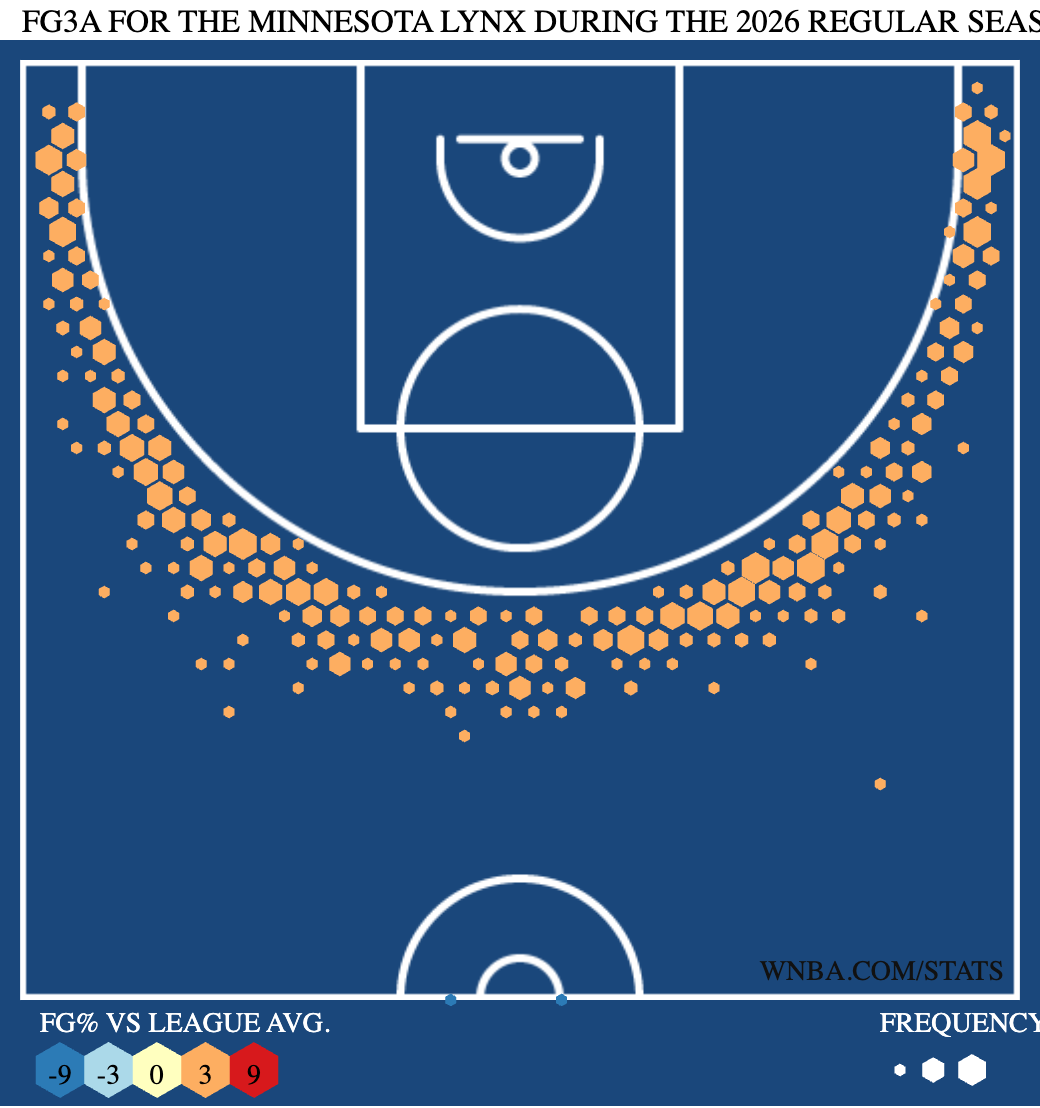
Maps of the Fever’s scattershot 3-point attempts (left) versus the tight spread of the Lynx’s tries (right).
Meanwhile, the Lynx emphasize keeping their 3-pointers short and sweet, taking near 90% of their threes from 25 feet in or closer. Much of this stems from Kayla McBride being their highest usage sniper. Unlike the Fever’s double trouble guards, McBride does her damage almost entirely from catch-and-shoot opportunities and off-ball actions like pindowns and baseline drifts. She has perfected her footwork and gathers to consistently trigger her threes from just behind the line, enabling ultra repeatable mechanics and a quick-as-a-hiccup release. All in all, McBride has taken a whopping 165 of her 186 threes this year from 25 feet and in and made the most of them, posting an elite 40.6% hit rate.
Now to put it all together: what happens when we combine each team’s volume of at-rim twos and short threes? Who takes these easy money shots to the bank the most often, and who is the most successful at cashing them out? And when it comes to overall offensive efficiency, how much of this even matters?
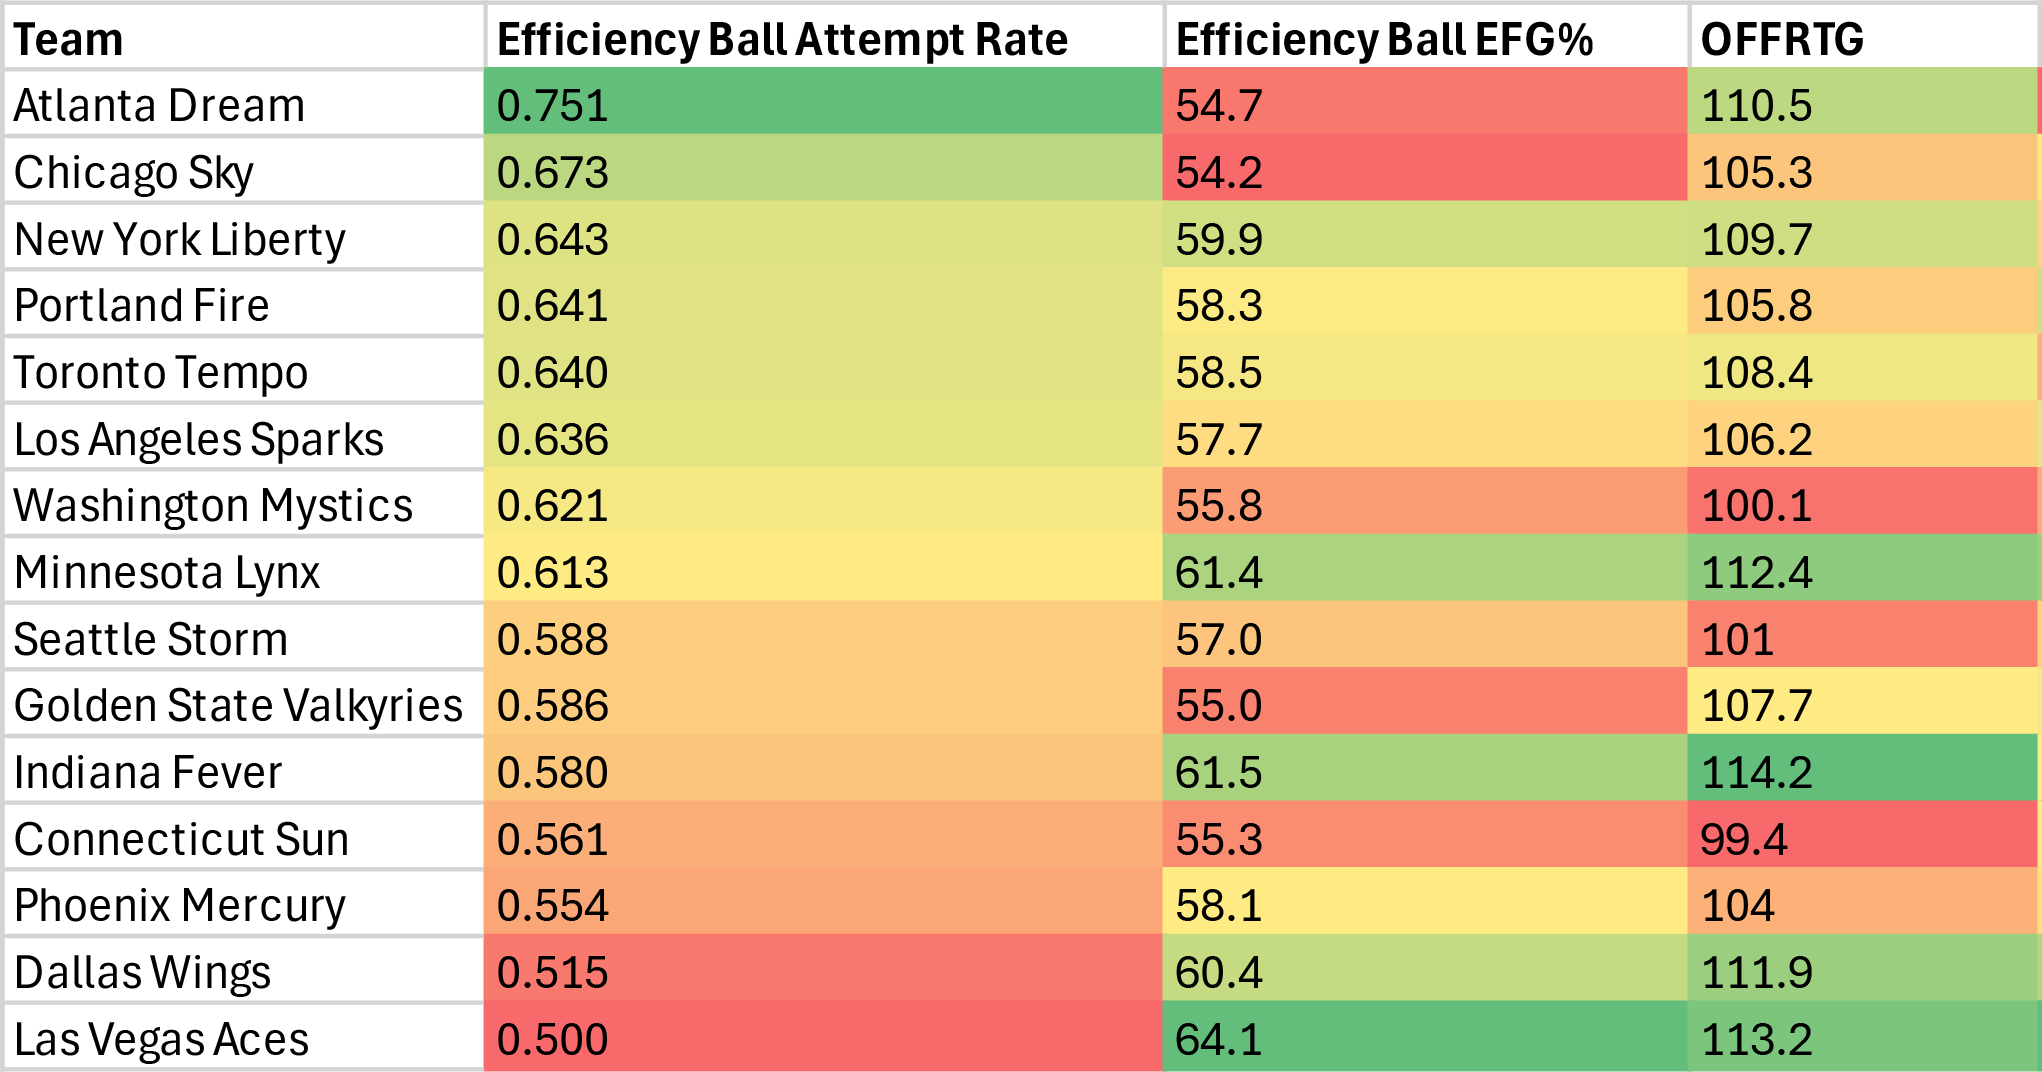
Short twos and threes do appear to be staples in everyone’s shot diet. Every team takes at least half of their shots from these areas, and the leaders of each Efficiency Ball category, the Dream in attempt rate, and the Aces in effective field goal percentage (EFG%), each boast a top-five offensive rating. But the juxtaposition of their methods is eye-opening.
The Dream hunt a staggering three-quarters of their shots from the premium spots in the paint and beyond the arc, well beyond anyone else, but their consistency in converting these looks leaves much to be desired. On the other side of the spectrum, the Aces have the proverbial hot hands but keep them jammed in their pockets. And they aren’t alone—among the top-five teams in OFFRTG, the Wings are also in the basement of Efficiency Ball aggression, and the Fever and Lynx only show a bit more teeth, seeking Efficiency Ball shots at below-average to average clips relative to the league. From a big picture view, it doesn’t seem the best offenses prioritize short twos or threes all that much.
Running a linear regression between Efficiency Ball attempt rates and team offensive rating confirms that the correlation between the two variables is too weak and directionally fluid to offer any semblance of one-to-one predictive value.
Compare this with a linear regression between Efficiency Ball EFG% and team offensive rating that spits out a statistically significant (p<0.05) positive correlation of 0.68 (r²=0.47, adjusted r² = 0.43). So the efficiency of Efficiency Ball matters. Quality over quantity as the saying goes. The top-four teams in EFG% on Efficiency Ball shots are also the top four in OFFRTG.
And for what it’s worth, when Efficiency Ball attempt rate is added as a second independent variable to the Efficiency Ball EFG% regression, the resulting multiple linear regression (MLR) model remains statistically significant (p<0.05) but with a more robust correlation of 0.78 and an adjusted r² of 0.54. Not too shabby for a three-variable model based on only a slice of each team’s shot selection.
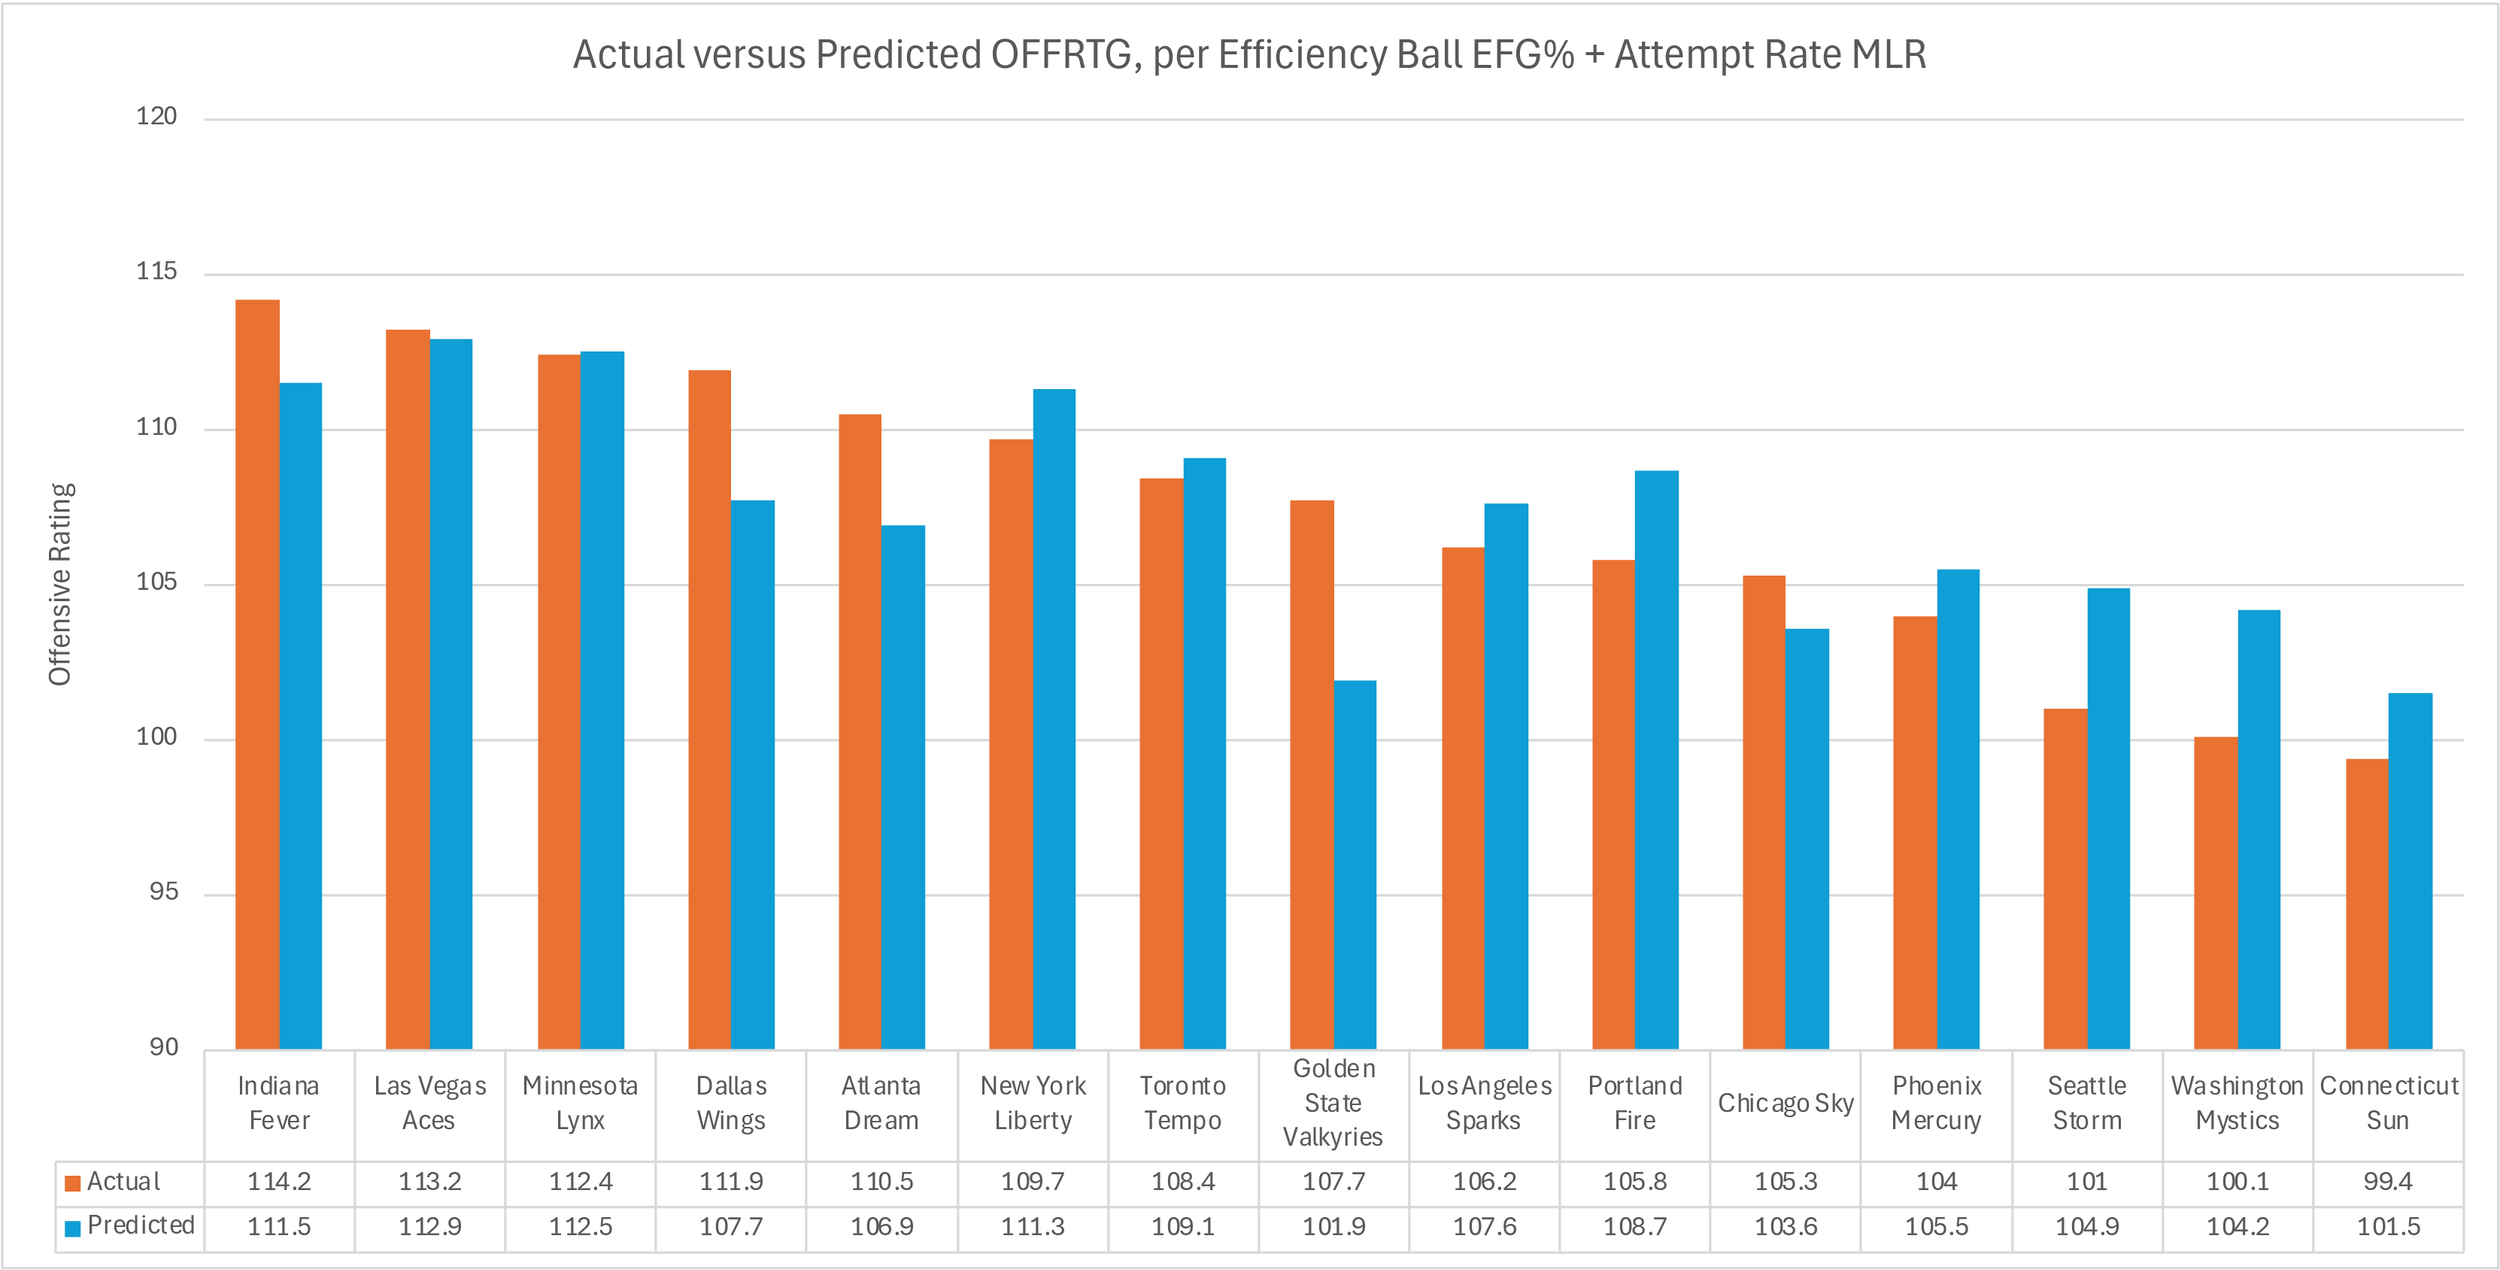
Actual team OFFRTG compared with the predictions of the Efficiency Ball EFG% + Attempt Rate MLR. Teams that outperform predictions likely excel in other areas such as OREB%, FTR, FT%, TOV%, and non-Efficiency Ball EFG%. For underperformers, the opposite applies.
The numbers say Efficiency Ball is a meaningful part of every team’s offense, but the merits of its execution outclass its raw usage. And this validates what hoopers and hoop heads have always known to be true: there is more than one way to win (and in this case, score effectively). The Lynx take disciplined short-as-possible threes. The Fever aren’t bashful to fling theirs halfway across the arena. The Aces and Wings love their analytically frowned-upon middys and save their rim attempts for clear advantage moments. So even though it’s gotten hazier over the years, the wisdom of, “the best shot to take is the one you can make,” remains fundamentally sound.
And yet, as the lone heavy practitioners of Efficiency Ball among the top five offenses, the Dream have shown that a strategy of going full buffet on at-rim 2s and just behind-the-line 3s can pay off too, even if the shots aren’t always falling, because the sheer volume can tilt the large-scale math in one’s favor. And to their credit, part of the advantage of taking so many shots at the rim is that it maximizes the chance to grab offensive boards and draw shooting fouls. And this has come to fruition, the Dream lead all teams in OREB% at 37.2% and come in second in FTA rate at 0.348, granting them a slew of second chance points and uncontested bonus points that other teams have trouble contending with.
But the most interesting takeaway from this peek at top offenses and their shot selection is that there’s plenty of meat left on the bone. Three-point aficionados Lynx and Fever could stand to hoist a few more deep ones. Restricted area virtuosos Aces and Wings would benefit from bullying their way inside more often. The uber-aggressive Dream could climb themselves out of the efficiency abyss and start truly cashing out on their money-making shot diet. If any of these record-pace offenses figure these wrinkles out, they won’t just shatter historical precedent, they’ll set the new standard.
All stats pulled from stats.wnba.com